Authors: Barry Simon Graham (Group Co-CIO) and Michael Yaw Appiah (Group Co-CIO)


This is Part B of our Investment Outlook 2025 series. You can access and explore Part A, “Thriving Amid Change: Tapping The Strength of Upward Ocean Currents – Outlook 2025”, at this link. In this publication, we delve into critical themes poised to influence the private markets landscape in the coming cycles. Gain deeper insights into the challenges and opportunities that could shape 2025 and drive transformational change over the next two decades.
In the context of our “New Economic Era“ framework, we observe that intersecting “vital cornerstones” are paving the way for long-term growth, fostering a new environment for private assets. The key elements of private markets in 2024 remained subdued but recovering, creating the conditions for a fresh phase of growth. This phase is expected to include elevated investment levels, a potential uptick in exits, reduced financing costs, and stronger demand for long-term capital. The rise of global liquidity and a more favorable rate environment has supported and/or will gradually support IPO and M&A activities; influencing private market trends. With dry powder poised for deployment, we anticipate a marked increase in activity in 2025 as pricing normalizes.
Despite “somewhat” increased distributions, investors are expected to maintain a sharp focus on capital needs and portfolio liquidity, ensuring secondaries remain a vital portfolio management tool. The 2025 global economic outlook suggests potential divergence, led by the U.S., while rising distributions and deal activity are likely to facilitate capital recycling and support a rebound in fundraising.
The current landscape is marked by volatility and an increasing frequency of secular shocks, where private markets excel due to their long-term investment approach. Geopolitical concerns remain a key focus for investors. In 2024 alone, over 70 elections occurred globally (including in the United States), involving half of the world’s population. These events have far-reaching implications for policies, geopolitical tensions, trade, supply chains, and energy security in 2025 and the next decade. A renewed emphasis on investing in the real economy is set to reshape markets, as more companies choose to remain private for extended periods.
Resilient Private Markets
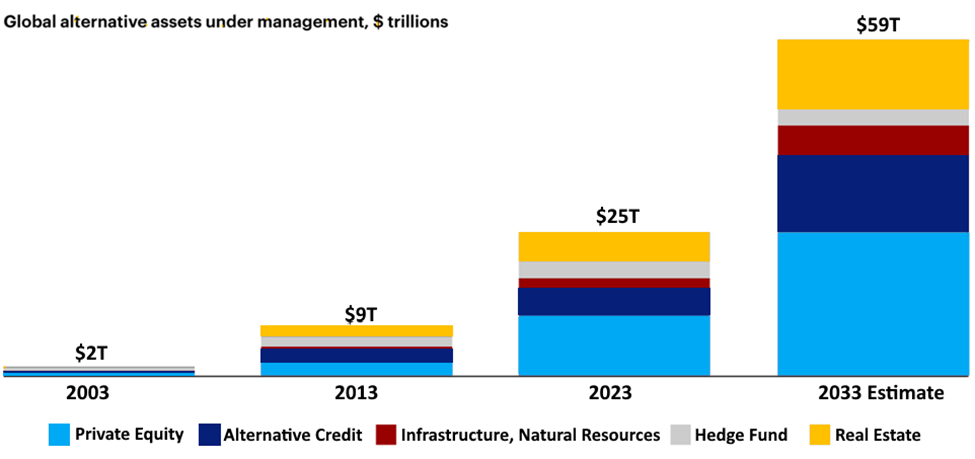
The private market ecosystem is experiencing rapid growth and expanding their accessibility to a wider investor base (Exhibit 18). This evolution is driven by increasing interest from relevant interest entities, governments and regulators in enabling defined contribution plans to access these assets, alongside the efforts of wealth managers and private banks to offer private market investments to high-net-worth individuals. While this presents exciting opportunities, it also brings forth significant challenges.
Managing these emerging asset classes necessitates the development of new processes and sophisticated portfolio construction strategies. Key considerations include ensuring appropriate diversification, managing liquidity risks, and mitigating the J-curve effect. Achieving these goals requires a robust toolkit, including sophisticated modeling capabilities for cash flow forecasting, liquidity management, and portfolio optimization. Furthermore, careful consideration must be given to the optimal allocation between private and public market assets to maintain liquidity and enhance overall portfolio performance.
Exhibit 18: Alternative Assets Should Continue to See Strong Growth
Diverging Distribution Trends Across Private Market Asset Classes
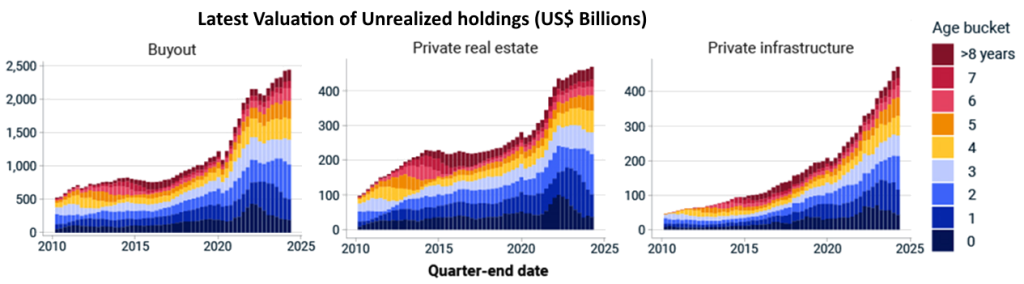
The private market landscape is characterized by diverging trends in fund distributions and increasing holding periods. While private real estate has experienced a significant slowdown in distributions, venture capital, buyout, and private credit have maintained distribution rates closer to historical norms. Private credit has continued to demonstrate superior returns compared to private equity and private real estate. Furthermore, holding periods across key asset classes have been on the rise, with venture capital reaching a record-high weighted-average holding age of 5.4 years (Exhibit 19A, 19B, 19C).
In 2025, we believe analyzing vintage trends will be essential. We foresee greater amendment and covenant default activity in vintages formed during periods of extraordinarily low interest rates, particularly when compared to more recent vintages.
Exhibit 19A: While Showing Signs of a Modest Recovery, Faster Distributions Across All Private Market Asset Classes Have Experienced a Significant Decline.
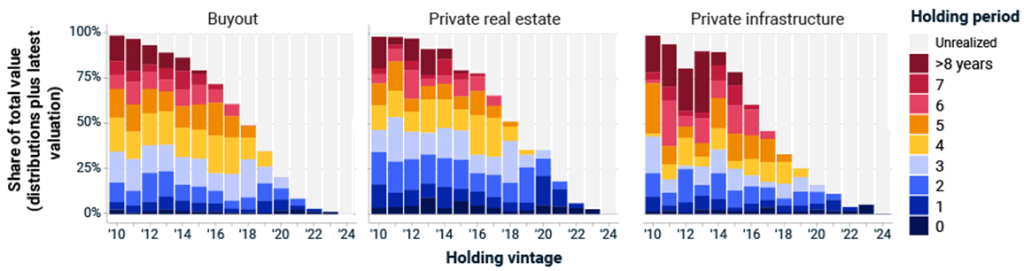
Exhibit 19B: Mid-Life Vintages Have Stalled. Some Fund Vintages, Net Cash Flows Have Stumbled

Exhibit 19C: A Substantial Backlog of Unrealized Assets is Hindering Distribution Payouts Across Major Asset Classes
Central Themes
In light of the uncertain market environment this year and in the next decade, we consider it essential to focus on investment principles that can offer a degree of resilience. Our “vital cornerstones” thesis explores these critical elements in detail.
1 Infrastructure
Private Markets Infrastructure, encompassing unlisted assets, has emerged as a highly sought-after asset class in recent years. This preference stems from its demonstrated ability to outperform during periods of market volatility, consistently generate alpha and yield, provide a hedge against inflation, and offer a crucial buffer against economic shocks. Furthermore, private markets infrastructure plays a vital role in supporting the real economy. Beyond traditional sectors like utilities and conventional energy, this asset class encompasses businesses critical for long-term energy security (LNG, renewables, energy-from-waste), the digital revolution (fiber optic networks, data centers, telecom towers), the reshoring of industries, and other rapidly expanding sectors of the economy.
Recent trends suggest two of our “vital cornerstones” themes in “Sunny Side of Shifting Currents” Outlook 2024 – “digitalization” and “decarbonization”, are partly converging as the energy needs of data centers and industrial consumers outpace supply. The surge in data demand, driven by technologies like Industrial robotics and AI, highlights the need to invest in the physical digital infrastructure supporting the digital ecosystem, including data centers, fiber optic networks, and wireless towers. Addressing this digital energy gap will require extensive capital-intensive projects in power generation, transmission, and storage (in case of batteries), as well as the adoption of cutting-edge energy technologies. This convergence presents a dual challenge and opportunity, with the potential for significant returns for those with the expertise and resources to lead in this space.
Cornerstone #1: Artificial Intelligence (AI)
Just as we were preparing to go public with this publication, a groundbreaking revelation emerged—one that fundamentally reshapes everything we thought we knew. This new development not only challenges our initial conclusions but opens an entirely new dimension of understanding. In light of this revolutionary insight, we are unveiling an updated perspective that reflects the true scope of this discovery.
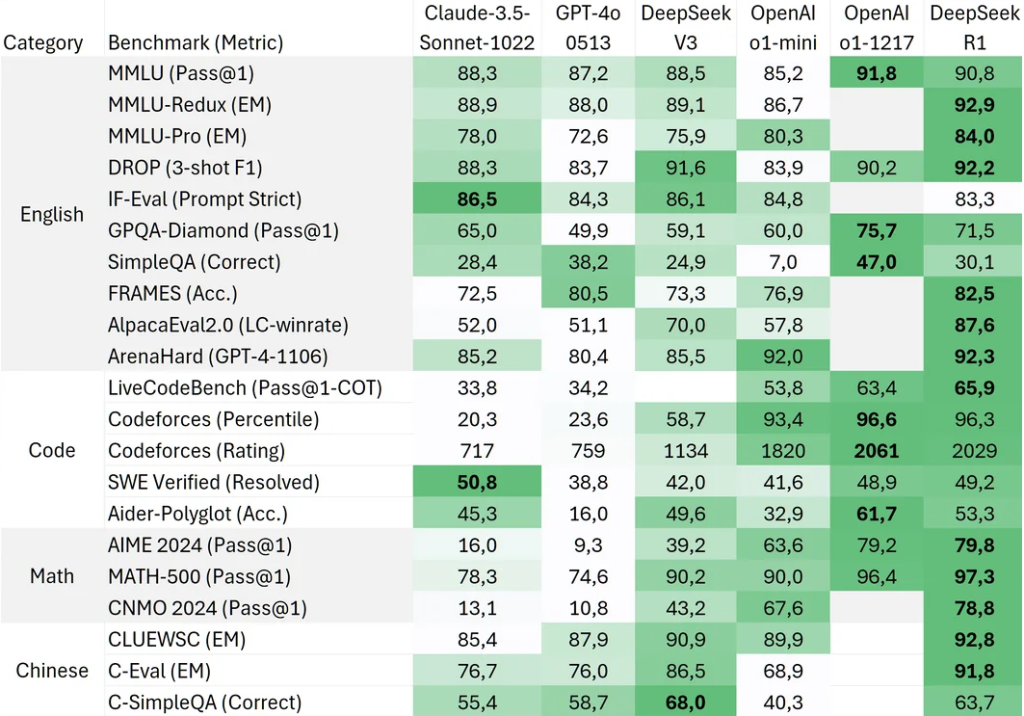
A relatively unknown Chinese startup has unleashed a groundbreaking AI platform (i.e., DeepSeek) that is not only more powerful but also significantly cheaper than existing Western alternatives. With its ability to perform complex computations (Exhibit 20) at a fraction of the cost, the company has triggered an industry-wide upheaval, forcing dominant players like NVIDIA, OpenAI, Google, and Microsoft to rethink their strategies. Global AI competition is no longer dictated by high capital expenditures but by efficiency, forcing U.S. and European firms into defensive maneuvers to maintain their relevance.
Exhibit 20: Revolutionary AI Platform (DeepSeek) Outperforming Western Rivals With Minimal Investments & Limited Infrastructure
The emergence of DeepSeek and other similar disruptive AI platform has significant implications for private markets, the global macro landscape, and capital allocation. Stakeholders must adapt quickly to this new reality, balancing the opportunities and challenges that come with it. Here are some few breakdowns of what this means:
Private market players will inevitably adapt to the evolving landscape. The following matrix highlights key factors to consider in this evolution.
- Shift in Investment Focus: Investors may pivot from traditional tech giants to nimble, innovative startups that leverage low-cost or open-source AI platforms. This could lead to a more decentralized AI investment landscape. Secondary markets could see increased activity as investors look to rebalance portfolios in response to the shifting AI landscape.
- Valuation Adjustments: The disruptive nature of disruptive AI startups could force downward revisions in the valuations of incumbent AI firms, as investors reassess their growth potential and market dominance.
- New Fundraising Opportunities: Several ongoing disruptive AI startup’s success could inspire a wave of new AI-focused funds, particularly those targeting emerging markets or niche use cases or applications of AI. Funds may also invest in AI-driven sectors such as healthcare, fintech, and logistics, where the startup’s technology can be rapidly deployed.
- Redirection of Capital Flows & Focus on Emerging Markets: Institutional investors redirecting capital toward China and other Emerging markets (EM), to tap into the innovation and cost advantages offered by the startups or new agile platforms. EMs in particular, may prioritize partnerships with Chinese AI firms over Western counterparts. Focusing on the adoption of cost-effective AI platforms could unlock significant growth opportunities.
- Resilient Supply Chains: AI-driven efficiencies could reshape global supply chains, making them more resilient and adaptable. Investments may prioritize AI integration in logistics, inventory management, and predictive analytics. Supply chain-focused investments may prioritize AI integration, particularly in logistics, inventory management, and predictive analytics.
- Labor Market Transformation: The widespread adoption of cost-effective AI solutions will disrupt labor markets, automating routine tasks and creating demand for new skill sets. Governments and corporations may increase spending on education and reskilling programs. Edtech startups focused on AI-related training and reskilling could attract significant investments.
A relatively unknown Chinese startup has unleashed a groundbreaking AI platform (i.e., DeepSeek) that is not only more powerful but also significantly cheaper than existing Western alternatives. …. Global AI competition is no longer dictated by high capital expenditures but by efficiency, forcing U.S. and European firms into defensive maneuvers to maintain their relevance.
– Barry Simon Graham (Group Co-CIO)
Is AI Infrastructure Thesis Still Strong Amid Budget AI Platforms?
Five years ago, the technology landscape – particularly in computing – was relatively stagnant, characterized by incremental hardware improvements. The recent explosion of AI and Large Language Models (LLMs) has dramatically changed this, creating a dynamic and exciting environment for world (Exhibit 21). However, the emergence of competitive platforms like DeepSeek raises two key questions: 1) Does the investment thesis for AI infrastructure growth remain robust? The answer is Yes! 2) Does the emergence of cheaper and capable AI platforms challenge the investment thesis for AI infrastructure? Absolutely Not!
Lowering AI Costs Will Unlock Its Full Potential & Drive Dramatic Market Expansion. Think of AI as obeying the “gas law”—it fills the “space” defined by available resources, whether that’s capital, power, or thermal budgets. Just as the “digital revolution 1.0” saw explosive growth with affordable hardware/tech asset (such as cloud, chips, PCs, mobile devices, etc.), cheaper AI will fuel its widespread adoption. Currently cost-prohibitive, AI’s potential across diverse sectors—from healthcare and materials research to autonomous driving and everyday devices—remains largely untapped. Lower costs will unleash this potential, enabling AI to adapt to human interfaces and fundamentally change what we can achieve. The data supports our view that AI affordability won’t shrink the industry; it will ignite explosive growth.
The massive growth of AI will demand massive capital allocation toward data center real estate, AI chips, power infrastructure, cooling solutions, fiber optics, edge computing assets, and so on. On top of this, government localization policies and reshoring mandates will create a surge in demand for data center operators, co-location providers, and hyperscalers. The numbers don’t lie—this is a golden moment for the AI infrastructure thesis.
Exhibit 21: Quality & Quantity of Computation Will Continue to Outperform Per Energy Consumption in Next Few Decades

Global Technology Sector
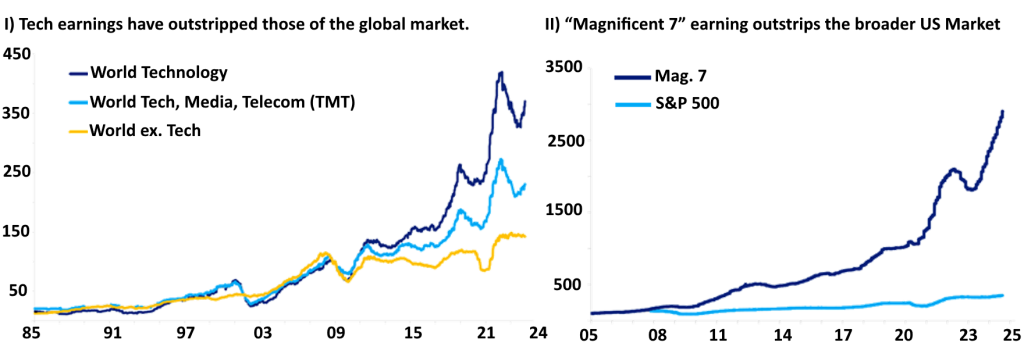
The technology sector has been a dominant force in public equity markets since 2010, contributing 33% of global equity returns and an impressive 42% of US equity market returns. This outperformance reflects strong underlying fundamentals, not speculative bubbles or irrational exuberance. Notably, global tech sector earnings per share (EPS) have surged approximately 400% since the peak before the Global Financial Crisis (GFC), while all other sectors combined have seen EPS growth of only around 25% (Exhibit 22).
Historically, disruptive technologies typically follow a cyclical path of rapid growth (boom), subsequent market collapse (bust), and ultimately, renewed growth (boom) driven by established players. The initial surge often attracts a wave of imitators, overwhelming the market and leading to a crash. This pattern repeats consistently, offering both significant risks and substantial opportunities.
Exhibit 22: The Tech Sector Has Consistently Outperformed, Defining The Trajectory of Public Equity Markets Since 2010
Consequently, investors exhibit several biases in technology markets. They tend to overemphasize the role of early innovators, underestimating the competitive forces that will emerge and often overestimating the returns on initial capital. Concurrently, investors frequently undervalue the potential of later entrants who can leverage the infrastructure and investments made by pioneers to develop innovative products and services. Furthermore, valuations often fail to fully capture the significant opportunities that can arise in non-technology sectors as they adopt and integrate these technologies, leading to enhanced returns across existing and new product lines.
From the ashes of failed technology ventures, survivors emerge, leveraging the infrastructure and resources left behind. This ‘phoenix effect’ fuels innovation, paving the way for new products and services that capitalize on the groundwork laid by their predecessors.
The massive growth of AI will demand massive capital allocation toward data center real estate, AI chips, power infrastructure, cooling solutions, fiber optics, edge computing assets, and so on. On top of this, government localization policies and reshoring mandates will create a surge in demand for data center operators, co-location providers, etc.. The numbers don’t lie—this is a golden moment for the AI infrastructure thesis.
– Michael Yaw Appiah (Group Co-CIO)
From Builders to Innovators
Unlike previous innovation bubbles (railways, canals, radio, the telegram, etc.), where dominant companies often emerged from the preceding wave, the current “western” AI landscape presents a different dynamic. The existing tech giants, fueled by advertising revenue, possess the financial firepower to aggressively pursue AI development through substantial capital expenditure. Even though they have outspent their rivals, that in itself is not enough to guarantee them insurmountable monopolies in the evolving AI ecosystem.
The rapid surge in AI-related patents signals a looming wave of competition; at least proven by Chinese AI platform DeepSeek and others. This, coupled with the explosive growth of cheaper, open-source AI models (exemplified by Hugging Face’s vast repository of over 600,000 models), suggests that the AI landscape is poised for a period of intense competition and rapid innovation, mirroring the trajectory of previous technological revolutions.
Historically, while the revolutionary potential of major technological breakthroughs is often apparent, the precise business models that will successfully scale and commercialize them remain highly uncertain in their infancy. The early internet era exemplifies this ambiguity. While investors eagerly sought exposure to this burgeoning sector, established telecom companies were initially perceived as the most promising avenue. Their existing infrastructure and market dominance made them appear a safer bet than the largely unprofitable and speculative dot-com startups.
The challenge historically wasn’t underestimating the growth potential of the technology but overestimating the future value of the companies building the infrastructure. In such cases, the true winners emerged as those who could “leverage“ on existing infrastructure, creating business models that leveraged the existing capacity & technology to deliver innovative products and services. This pattern became evident with the advent of smartphones in 2006, which spurred a wave of app-driven industries, including platforms for ride-sharing, social media, etc., thereby redefined industries and created new winners –while at the same time reshaped economic landscape.
The Changing Investment Reality of AI Infrastructure
The explosive growth of AI data centers, semiconductor demand, GPU-driven computing and complex cloud ecosystems has fueled a multi-trillion-dollar AI infrastructure boom. For years, Western AI firms have relied on capital-heavy infrastructure to power their AI models. However, a Chinese platform has revolutionized AI efficiency, drastically reducing hardware and energy requirements. This shift erodes the competitive moat of Western AI giants, allowing companies, governments, and small businesses worldwide to deploy state-of-the-art AI at minimal cost. The AI economy no longer favors those with vast infrastructure but instead rewards those who innovate with AI applications.
This capital-light AI platform has the potential to enable industries to deploy cutting-edge AI without the need for billion-dollar infrastructure investments, marking the end of the AI hardware arms race. This we believe will consequently lead to the following major shifts:
##1st – AI becomes software-driven, reducing reliance on cloud giants and hyperscalers.
##2nd – Startups & mid-sized enterprises gain access to powerful AI without needing deep capital reserves.
##3rd – Institutional investors reconsider capital-heavy AI infrastructure allocations as returns compress.
Despite the perception of AI as a purely software-driven phenomenon (i.e., capital-light industry), today’s western AI leaders are capital-intensive. This echoes the experience of early internet companies, where heavy infrastructure investments became paramount. This capital expenditure boom threatens to erode the high profit margins that have defined the sector in recent years, casting doubt on current lofty valuations. Furthermore, there’s little evidence that substantial technology investments translate into longer-lasting intellectual property advantages. Additionally, the market dominance of early movers like ChatGPT remains far from guaranteed as DeepSeek as proven with a competitive and cheaper platform.
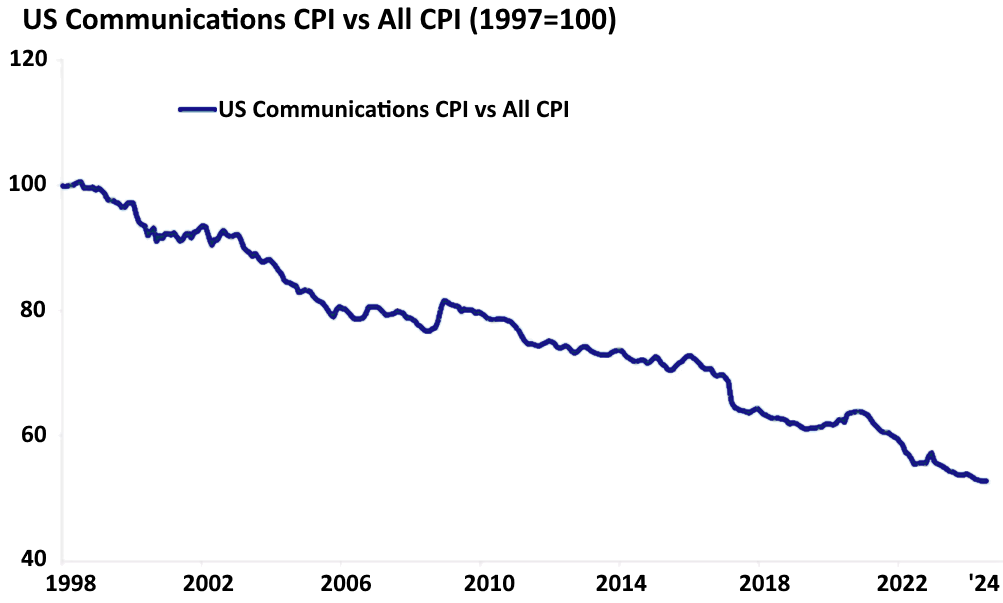
There’s a compelling argument that technology, at its core, is inherently deflationary (Exhibit 23) and thus presents a complex landscape for investors. While this may be advantageous for navigating antitrust scrutiny, it poses a significant challenge for maintaining robust profit margins. Therefore, investors should prioritize diversification of portfolio. Instead of further concentrating their holdings in firms like Nvidia, OpenAI, etc., a more prudent approach to capitalize on the generative AI themes.
Exhibit 23: The Technology Sector is Deflationary
We believe the success of China’s “DeepSeek” AI platform and other future peers will bring major permanent impact to the marketplace:
##1 Acceleration of Margin Compression. A breakthrough AI platform offers unmatched operational efficiency at a fraction of the cost, eroding profit margins for S&P 500 leaders reliant on premium pricing models. Companies that fail to adopt the new technology or integrate it effectively are outcompeted, leading to downward pressure on valuations and increased market uncertainty. Unforeseen risks include: a) Profit margins shrink across industries reliant on traditional AI solutions; b) Reduced investor confidence in firms slow to adapt, triggering valuation declines; and c) Financial contagion as asset managers reallocate capital away from affected sectors.
##2 Shift in Market Capitalization Hierarchy. The affordability and accessibility of a next-generation AI platform democratize innovation, enabling a wave of new entrants to challenge S&P 500 leaders. Established firms see their market caps erode as disruptors gain traction in key industries such as cloud computing, e-commerce, and semiconductors. This recalibration of market capitalization alters the composition of global indices, creating volatility and uncertainty for institutional investors. Unforeseen risks include: a) Forced rebalancing of institutional portfolios, amplifying market volatility; b) Loss of investor trust in long-established companies, accelerating valuation declines; and c) Changes to index structures, affecting passive investment strategies.
##3 Repricing of Innovation Value. The unforeseen emergence of a more advanced AI platform has fundamentally changed how markets value innovation. Top S&P 500 firms that once dominated AI ecosystems could face rapid obsolescence as the new platform renders their technology redundant. The repricing of these firms reshapes investment strategies, while industries dependent on their solutions face productivity and profitability challenges. Unforeseen risks include: a) Devaluation of innovation-focused firms reliant on now-outdated AI solutions; b) Sudden shifts in corporate R&D priorities, increasing operational risks; and c) Broader market uncertainty as investors struggle to assess the long-term impact of technological displacement.
AI infrastructure Investment Themes
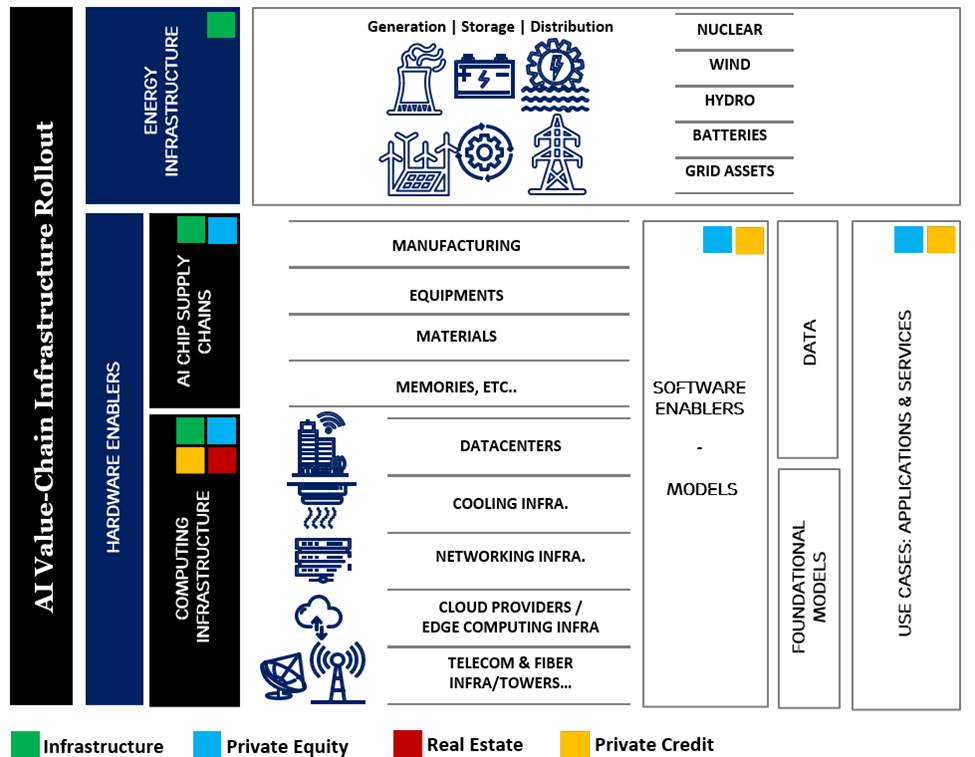
A thorough understanding of the unique demands placed upon AI-ready infrastructure illuminates a landscape rich with potential for institutional investors. The waves of AI investments will be focused on foundational elements; key opportunities within this burgeoning market includes (Exhibit 24):
- Building Hardware Enablers Primarily Computing Infrastructure (such as AI ready Datacenters and AI Semiconductors supply chains).
- Scaling Energy Infrastructure primarily power systems and smart grids.
- Software Enablers Primarily Models, Data and Use Cases (i.e., Applications and Services).
Exhibit 24: AI Infrastructure – Investment Themes. What Asset Classes Do You Allocate Capital?
Theme #1: AI Data Center Infrastructure
Globally, there are more than 11,500 registered data centers, but the majority have yet to adopt AI-focused activities. Based on mid-2024 figures from the IEA, these centers collectively consume about 1.0%-1.5% of global electricity, excluding cryptocurrency usage. In the United States (~4%) and the European Union (~3%), their energy consumption is disproportionately higher, reflecting their dominant market positions.
Our analysis, based on a rigorous bottom-up approach utilizing utilities’ forward-looking supply contracts, reveals a dramatic shift in US data center energy demand driven by AI advancements. We project an annual growth rate of 17%-25% through 2035, leading to a threefold increase in demand from 150-175 TWh in 2023 to potentially 560 TWh by 2030-35. This substantial growth would represent 14% of US electricity consumption by 2030-35, a significant departure from the current 0.6-2.5%. It’s important to note that this projection exceeds the estimates of other key players in the field, including DC Byte, S&P Global, McKinsey, EPRI, and the IEA (Exhibit 25).
Predicting these trends is fraught with uncertainty. Relevant data is often inaccessible, modeling efficiency gains presents challenges, and the speed of AI adoption remains unpredictable. Additionally, efforts to expand data center capacity face potential hurdles, such as production bottlenecks for chips and critical grid equipment, as well as regional grid limitations. Moreover, growing “Locally Unwanted Land Use” (LULU) opposition to proposed data centers, particularly in regions where they offer few full-time jobs, adds to the complexity.
A significant oversight in net-zero targets is the burgeoning energy consumption of AI and data centers. The collective energy demands of tech giants like Alphabet, Meta, and Microsoft have surged by at least 25% annually since 2017, a trend likely to intensify as AI applications expand
Exhibit 25: Projected Annual Growth in US Data Center Power Demand Through 2030

Theme #2: Digital Energy Infrastructure & Power Supply
The possibility of surge in AI-driven data center presents a unique opportunity for players across the energy infrastructure and power supply value chain. This includes businesses focused on increasing the generation and distribution of renewable energy sources, developing innovative on-site sustainable power solutions such as fuel cells, solar power, and small modular reactors, and exploring innovative ways to repurpose the significant heat generated by data centers for residential or commercial heating purposes.
The expansion of data center capacity is a foregone conclusion, yet its trajectory is subject to a constellation of unpredictable variables. These include the rate at which cutting-edge AI applications are embraced, the specific types of chips utilized and their corresponding energy consumption, and the dynamic interplay between cloud and edge computing in the execution of AI workloads. Moreover, the evolving computational, storage, and networking requirements of AI tasks will exert a profound influence on the infrastructural demands of the future.
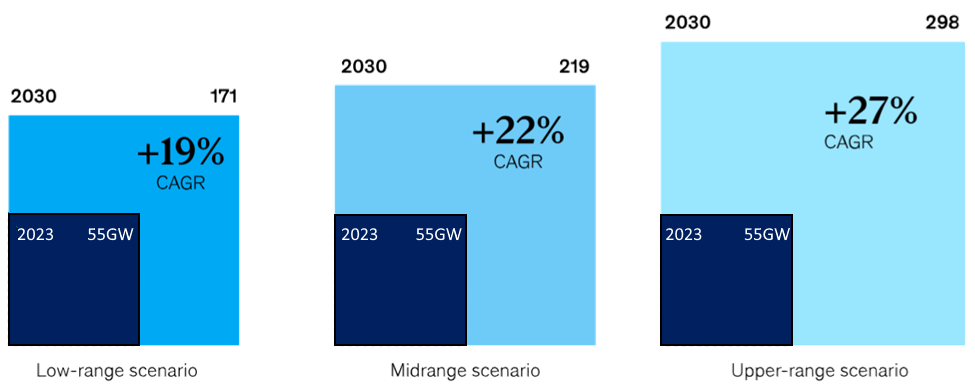
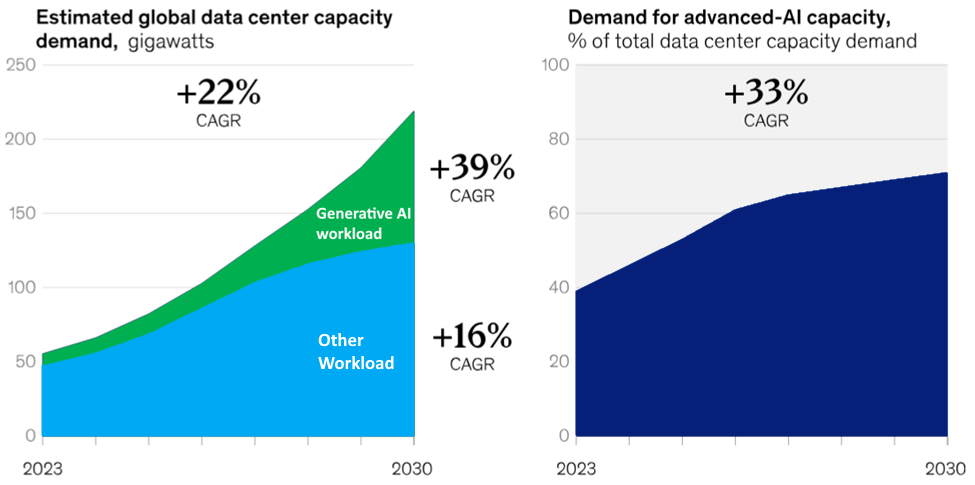
Global demand for data center capacity is projected to skyrocket between 2023 and 2030 (Exhibit 26A), potentially increasing at an annual rate of 19% to 27%. This translates to a staggering annual demand of 171 to 298 gigawatts (GW) by 2030, compared to the current 60 GW. This rapid growth presents a significant risk of a supply-demand imbalance, potentially leading to a severe capacity deficit. To avert this crisis, the industry would need to double the total data center capacity built since 2000 in less than a quarter of the time, a monumental undertaking.
Exhibit 26A: Global Appetite For Data Center Capacity Projected 3x By 2030, Reflecting Need For High-Performance Infrastructure
The primary driver of anticipated data center capacity shortfalls is the surge in demand for AI-ready infrastructure. These facilities must possess the high computational power and energy density necessary to support demanding AI workloads. Our analysis projects a 33% annual growth rate in demand for AI-ready data centers between 2023 and 2030 under a moderate scenario. By 2030, approximately 70% of total data center capacity demand is expected to stem from AI-driven applications. Within this segment, Generative AI, currently the fastest-growing AI subfield, is projected to account for roughly 40% of overall demand (Exhibit 26A, 26B).
Exhibit 26B: AI’s Data-Cravings Driving Need for More Powerful Data Centers
The Hyperscaler Effect on Data Center Capacity
The cloud infrastructure landscape is shaped by hyperscalers, with companies like Baidu, Amazon Web Services, Google Cloud, Microsoft Azure and Alibaba Cloud, leading capacity demand. Their focus on running large-scale AI models—be it proprietary projects like Google’s Gemini or hosting external models like OpenAI’s ChatGPT—has made them the key drivers of AI-ready data center expansion.
Cloud Service Providers (CSPs), holding the lion’s share of existing AI-ready data centers, are actively expanding their infrastructure to meet the burgeoning demand. To mitigate potential supply chain bottlenecks, they are increasingly partnering with colocation providers. Furthermore, a distinct segment of GPU cloud providers is gaining traction, offering specialized high-performance GPU services for AI model training. These providers frequently collaborate with colocation providers to build and operate their data centers.
The increasing demand for power from burgeoning data centers is straining grids in traditional hub markets such as (but not limited to):
- North America: Northern Virgina, Dallas-Ft. Worth, Silicon Valley and Chicago
- Europe: Frankfurt, London, Amsterdam and Paris.
- LATAM: Querétaro (Mexico), Sáo Paulo (Brazil), Santiago (Chile) and Bogotá (Colombia).
- APAC: Singapore, Tokyo, Hong Kong and Sydney.
Utilities struggle to expand transmission infrastructure at the pace required, raising concerns about future power shortages. This is driving a shift towards more remote locations with abundant power resources and less grid congestion. Innovative solutions are emerging, including colocation with power plants and on-site power generation through behind-the-meter solutions like fuel cells, batteries, and renewables. In the long run, small modular reactors (SMRs) may offer a viable alternative.
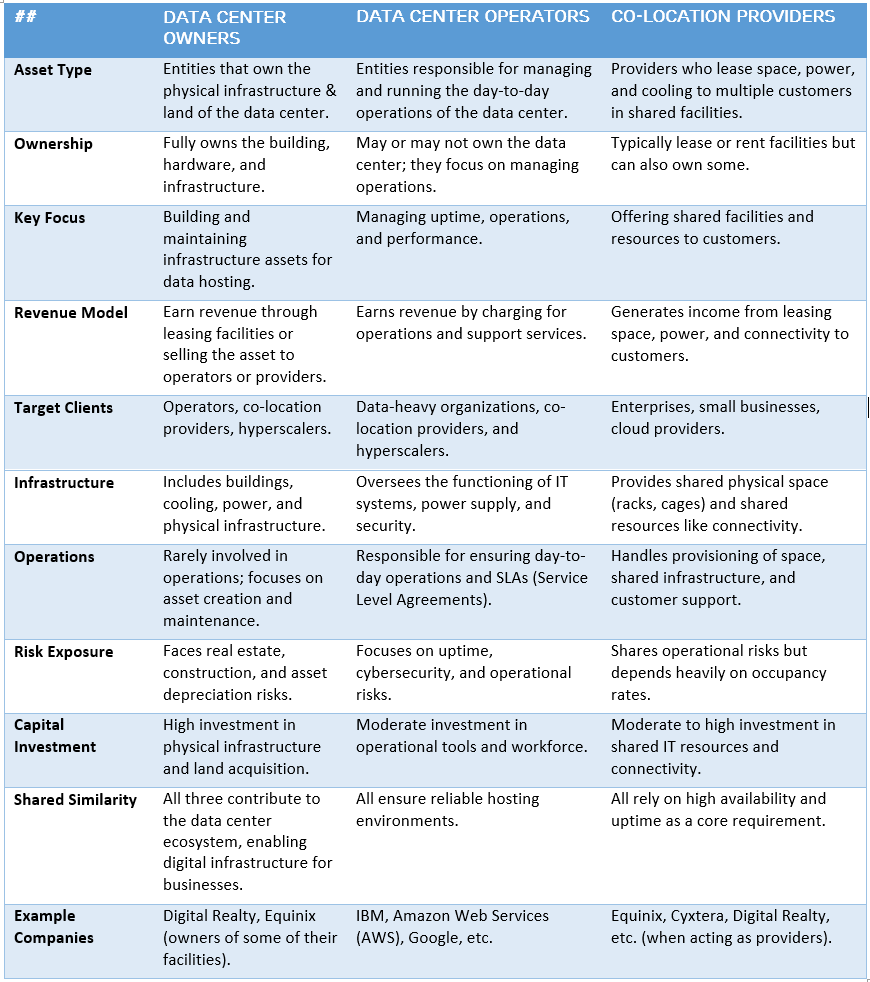
Theme #3: Co-Location Providers, Data Center Owners & Operators
Owners and operators of data centers are well-positioned to meet surging demand by retrofitting existing facilities and building new ones, especially for hyperscalers struggling to keep up with growth. Colocation providers offering build-to-suit services—tailoring data centers to the unique specifications of hyperscalers—are emerging as attractive partners. GPU cloud providers are also gaining investor interest as companies like Nvidia expand their customer base beyond hyperscalers, opening new avenues for growth (Exhibit 28).
Theme #4: Data Center Construction Firms & Equipment Suppliers
The data center construction market is experiencing explosive growth (which we believe could last between 10-20 years) see Exhibit 27, 28, creating a strong demand for both construction companies and equipment suppliers. Modular construction is gaining prominence, offering faster deployment and improved sustainability. Concurrently, the demand for high-performance mechanical and electrical equipment within data centers is soaring. According to Zinqular Research Hub estimates, capital spending on these systems is projected to exceed $300 billion by 2030, highlighting the immense market potential.
Exhibit 27: U.S. Private Data Center Construction Investments (Seasonally Adjusted Annual Rate)
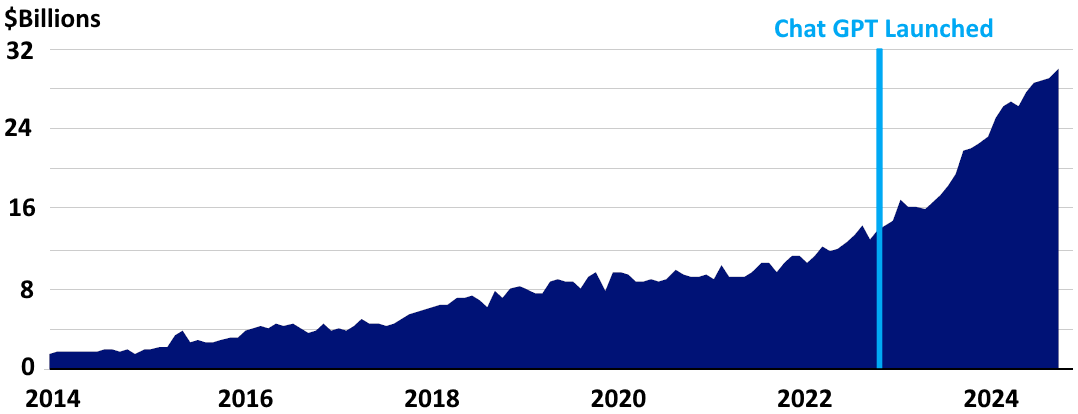
Exhibit 28: Data Centers Owners, Operators & Co-Location Providers
Global demand for data center capacity is projected to skyrocket between 2023 and 2030, potentially increasing at an annual rate of 19% to 27%. This translates to a staggering annual demand of 171 to 298 gigawatts (GW) by 2030, compared to the current 60 GW. This rapid growth presents a significant risk of a supply-demand imbalance, potentially leading to a severe capacity deficit.
– Michael Yaw Appiah (Group Co-CIO)
Energy Density vs Decarbonization
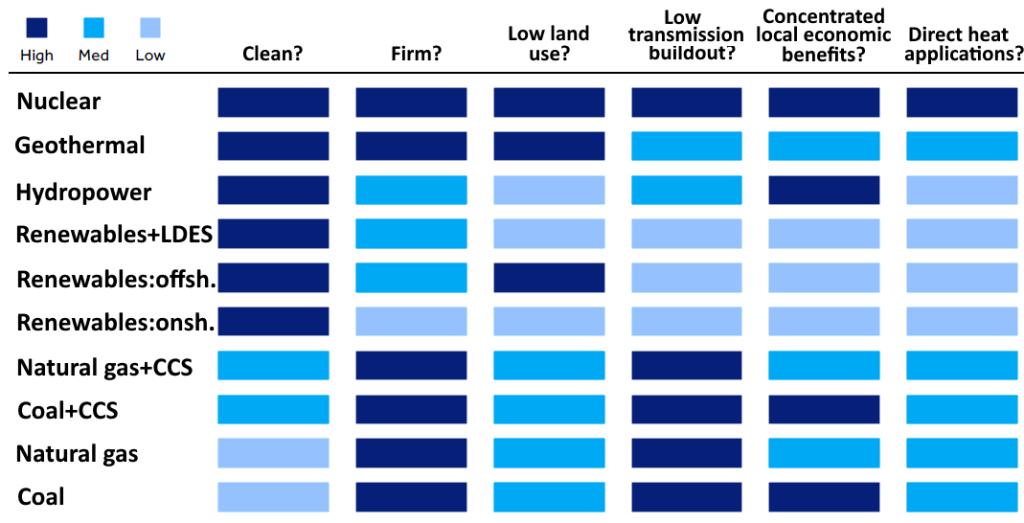
High energy density supports decarbonization thesis. Energy sources with high energy density, such as Nuclear, Hydrogen (liquid/compressed), Fossil Fuels, and Natural Gas (list is decreasing order of energy density), can deliver large amounts of energy with minimal carbon emissions, aiding the transition to a low-carbon economy. Energy density refers to the amount of energy stored in a given system or material per unit of volume or mass. It is a critical metric for evaluating the efficiency, practicality, and environmental impact of energy sources. Higher energy density means more energy can be delivered or stored in a smaller, lighter form, making it a key factor in energy system design and decarbonization efforts (Exhibit 29). Some few thoughts:
##1: Nuclear Power – plays a crucial role in decarbonization efforts. Its reliable, carbon-free energy output significantly reduces the reliance on intermittent renewables, thereby lowering the cost of grid infrastructure and energy storage. Moreover, nuclear power facilitates the production of hydrogen, further expanding its contribution to a clean energy future. The data center industry is increasingly turning to Small Modular Reactors (SMRs) as a clean energy solution. These advanced reactors, with a fraction of the generating capacity of traditional nuclear plants, offer faster deployment and lower construction costs. Companies like Amazon and data center providers are actively pursuing SMRs to meet their growing energy demands while reducing their carbon footprint. Oklo, a leading SMR developer, has already secured power purchase agreements with several major data center operators.
##2: Hydroelectric – is a strong source for base-load renewable power where geography allows. Hydroelectric power has a relatively high energy density compared to wind and solar because it harnesses the kinetic energy of flowing water, which is highly concentrated in dams or rivers.
##3: Renewable Energy Storage Challenges – Current battery technologies, while improving, have lower energy density compared to fossil fuels, highlighting the need for advancements in energy storage to support renewable energy adoption. Renewables face significant challenges in meeting the stringent demands of modern industry, particularly AI. These companies require consistent, controllable power (“firm” and “dispatchable”), which renewables struggle to provide due to their intermittent nature. The recent need for mobile gas generators at Twitter/ xAI facility and the construction of new natural gas plants to support Meta’s campus underscore the limitations of relying solely on renewable energy sources.
##4: Fossil Fuels – Still Dominate Due to Energy Density & Infrastructure. Despite their high energy content, their carbon emissions make them unsustainable. Alternative synthetic fuels, carbon capture, and renewables must replace them.
##5: Wind & Solar – Best for supplementing grids with low-carbon energy, but require storage and backup systems (batteries, hydrogen, or other dispatchable energy sources).
## 6: Other Energy Sources – We like higher density energy such as Nuclear, Hydrogen (liquid/ compressed), and Natural Gas sources of power for AI data center. The decarbonization efforts of hyperscalers are significant and impactful. Data suggests Amazon, Meta, Alphabet, and Microsoft are among the largest corporate purchasers of renewable energy, driving substantial demand for clean power. Microsoft’s May 2024 agreement for over 10.5 GW of renewable energy in the US and Europe set a new industry benchmark. This follows AWS’s successful procurement of electricity from an Irish wind farm, demonstrating the growing scale of hyperscaler investments in clean energy. The use of geothermal energy is on the rise. Microsoft, alongside Abu Dhabi-based AI firm G42, is backing a geothermal-powered data center in Olkaria, Kenya, and has also signed a geothermal PPA in New Zealand. Additionally, Google has collaborated with NV Energy, part of Berkshire Hathaway, to supply its Nevada data centers with energy sourced from Fervo Energy’s geothermal facility.
Fusion power, though still speculative, is based on the concept of controlled fusion, where two nuclei fuse to create a new nucleus. US firm Helion, has finalized a power purchase agreement (PPA) with Microsoft for a 2028 deployment. Meanwhile, the ongoing struggle to merge AI progress with net zero goals is most evident at Google, which has offset 100% of its global electricity demand with renewable energy purchases since 2017. Yet, the company still relies on carbon-emitting energy sources for local grids, due to regional disparities in renewable resource availability. In practice, Google’s data centers are powered by fossil fuels about 30% of the time globally, and 50% the time in eastern North America.
Exhibit 29: Powering AI: Data Center Electricity Sources – Performance & Sustainability
2 Private Equity
We believe 2025 is poised to bring a dynamic shift in the investing landscape, marked by increased fiscal spending, larger deficits, and a backdrop of higher inflation and interest rates. As these changes take shape, the growth trajectory will be the most crucial determinant of market outcomes. We anticipate a resurgence of private equity activity in 2025. A more favorable interest rate environment and the renewed momentum in M&A and IPO markets are creating a positive backdrop. This dynamic is expected to drive increased deal flow as private equity firms seek to deploy their substantial capital reserves
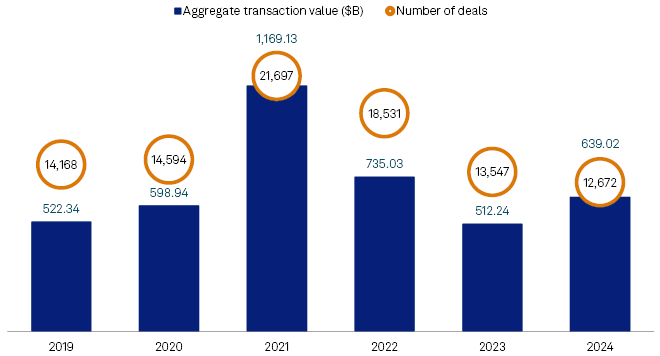
Despite a challenging macroeconomic environment, global private equity and venture capital deals demonstrated resilience in 2024. Aggregate deal value experienced a significant rebound, increasing by 25% year-over-year to reach $639 billion, marking the first year of growth since 2021. While transaction volume dipped slightly to 12,672 deals compared to 13,547 in 2023, the surge in deal value, driven largely by mega-deals exceeding $5 billion, underscores the enduring strength of these asset classes (Exhibit 30A, 30B, 30C).
Deal activity is showing positive signs of recovery. While caution persists, high-quality deals continue to attract strong competition and valuations. Importantly, a more active exit market and a renewed focus on capital return by GPs are providing much-needed relief to investors seeking distributions. The preceding year marked a significant milestone, with distributions surpassing capital calls for the first time in nine years.
Exhibit 30A: Private Capital’s Evolving Role in M&A; A 6-Year Perspective

Exhibit 30B: Exhibit 30B: Where’s the Action? PE/VC M&A Deals by Geography & Industry. US Dominance, Sector Spotlight
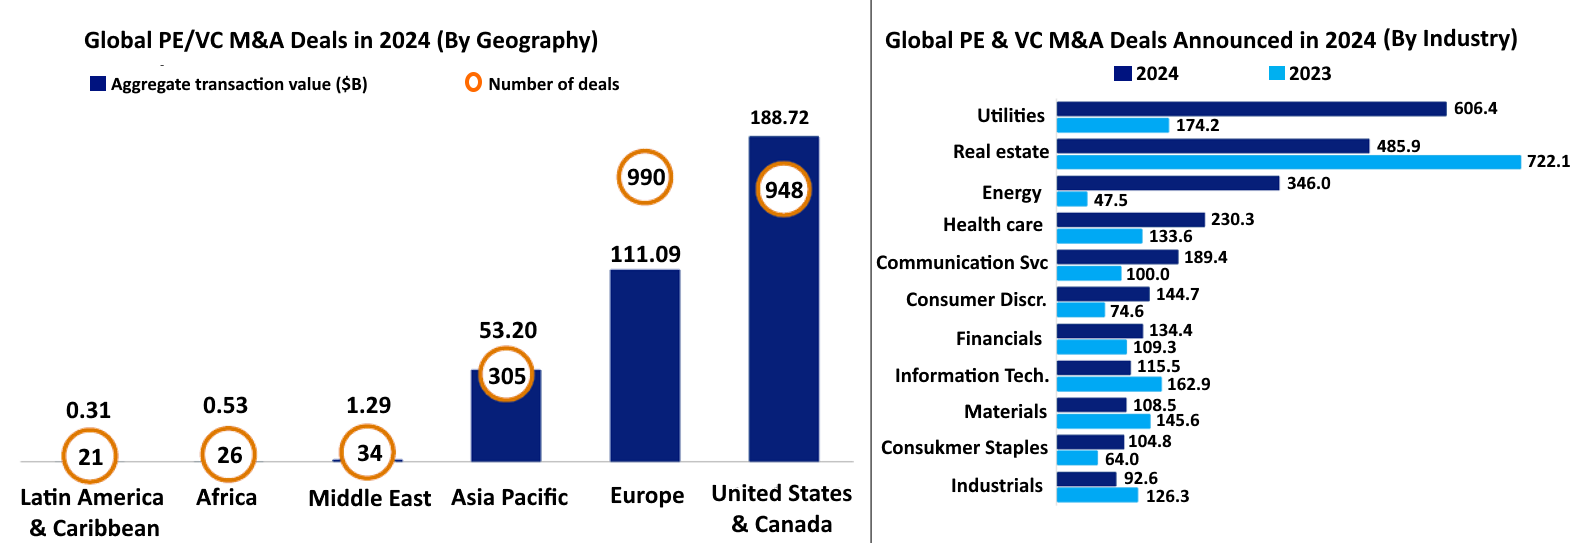
Exhibit 30C: Global PE/VC Investments Through Rounds of Funding from 2019-24
In summary, we anticipate a comprehensive improvement “in all fronts” for private equity deal activities in 2025. This follows a period of renewed strength in the second half of 2024, evidenced by a decline in dry powder. This marks only the second instance in the past decade and the first since 2021 where investment activity outpaced fundraising.
Mounting pressure on both sellers and buyers will likely fuel transaction activity. Extended hold periods and aging assets are pushing sellers to exit, even if it means accepting less than ideal valuations due to the widening bid-ask spread. Committed capital faces a deadline, adding to the sense of urgency. While we remain cautiously optimistic, ‘liquidity’ will be the defining characteristic of 2025, not due to scarcity but rather the sheer volume of capital seeking deployment.
In response to the slower exit environment of recent years, LPs and GPs have embraced alternative liquidity structures to achieve their liquidity goals. These solutions include structured continuation vehicles, mid-life recaps, NAV facilities, strip sales, and managed fund structures. As new investors, particularly from the wealth segment, enter the market, innovation in these structures is expected to accelerate. Wealth-focused investors are increasingly accessing private assets via evergreen fund structures and European Long Term Investment Funds – continues to shape the future of private market liquidity (Exhibit 31A).
A defining characteristic of the PE market has been the growing prevalence of carve-out and take-private deals. In 2024, carve-outs have gained further momentum as larger corporations strategically divest non-core businesses to enhance focus and unlock value. Despite high public market valuations, take-private deals continue to present attractive opportunities for PE firms.
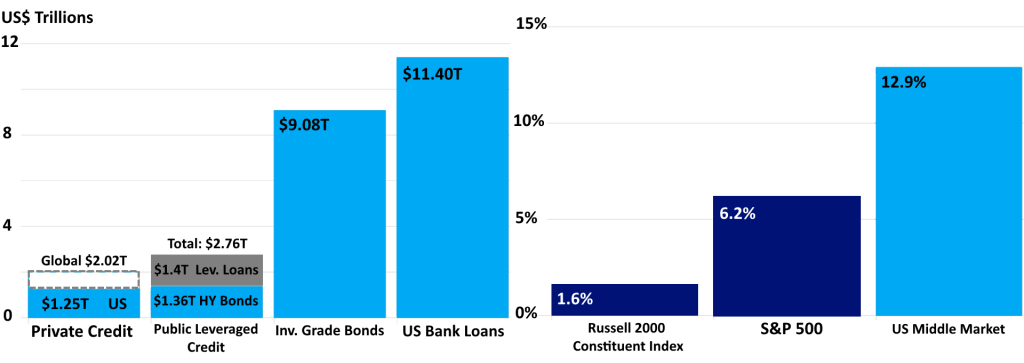
Despite the uncertain economic backdrop; the strength of corporate fundamentals persists, with more than 60% of private firms experiencing earnings growth. Notably, 80% of PE Buyout companies tracked by Capital IQ are profitable, outpacing the 48% profitability rate of companies in the Russell 2000 Index. As economic uncertainty lingers, the ability of managers to create value and improve operational efficiency will be key to achieving superior returns.
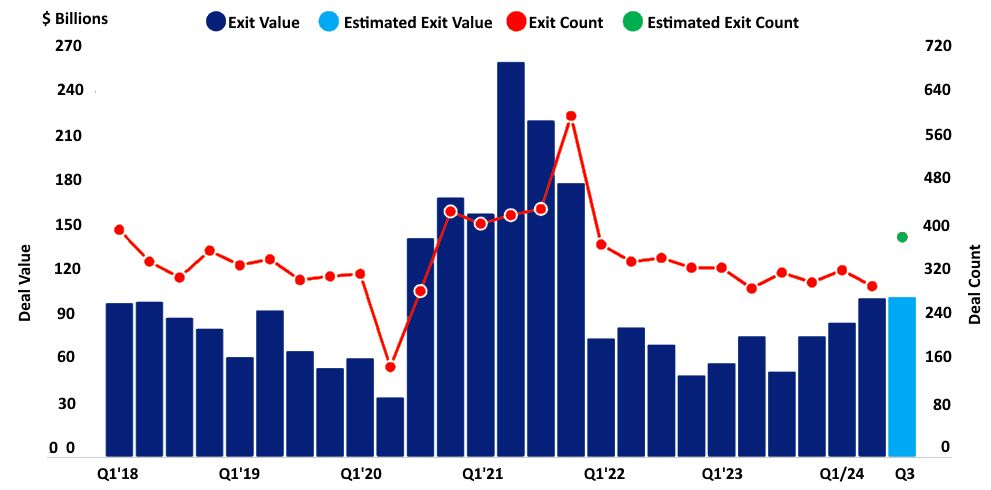
Last year, middle market drove private equity exit resurgence, with global buyout funds generating over 1800 exits from portfolio firms. This represents over 10% increase compared to 2023, according to Zinqular Research Hub data. This surge in activity follows a two-year period of slower exits, which had impacted investor returns and fundraising efforts.
Despite an increase in exit activity this year, transaction sizes are notably smaller than the 2023 average. This shift can be attributed to a decline in large-scale exits facilitated by major private equity firms. Rising interest rates since 2022 have compelled buyout fund managers to adopt a more hands-on approach. They are now prioritizing operational improvements, such as revenue growth and margin expansion, within their portfolio companies, rather than relying on multiple expansion for returns. Implementing these strategies might be more straightforward in the middle and lower-middle markets, where investments often support smaller, family-owned businesses.
In contrast, upper-market companies are typically led by established management teams, making it more challenging to introduce significant changes. In the US, exit values have increased significantly this year, surpassing a 51% year-over-year growth rate (Exhibit 31B). This trend reflects private equity firms prioritizing the sale of their most valuable assets.
Exhibit 31A: European Deal Value Grows Despite Decline in Transaction Volume
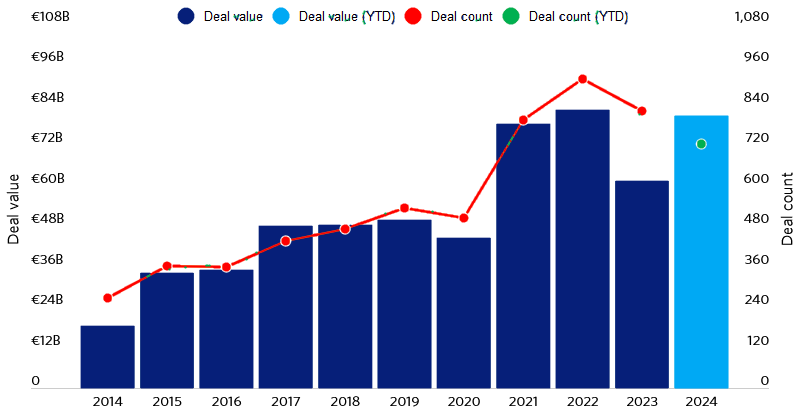
Exhibit 31B: US Private Equity Exit Values Soar 50% YoY
Compelling Entry Points in PE Market
Private equity valuations continue to trail public markets, offering investors attractive entry points. Unlike the swift corrections observed in public markets, private equity adjustments have been more measured. Notably, 2024 saw an uptick in valuations from 2023, fueled by the availability of exceptional assets.
In the coming months, valuations are expected to stabilize and become clearer as market volumes grow. The supportive interest rate conditions should continue to uplift private equity activity, as access to credit widens and borrowing costs decline. Compared to a year ago, financing conditions have improved with the reemergence of the syndicated loan market and increased participation by private debt funds.
The strong demand for liquidity from both LPs and GPs has fueled a robust secondary market. This has created a buyer’s market, characterized by ample dry powder and attractive discounts to Net Asset Value (NAV) often exceeding 10%. While lower discount rates may emerge, this doesn’t necessarily translate to lower returns. Enhanced visibility into exit strategies for portfolio companies can further support the overall return potential of secondary investments.
Our investors are increasingly interested in mid-life recapitalizations (once a niche asset class), which have grown from 2% of transactions in 2022 to 6% in 2024. These transactions are becoming more mainstream, providing investors with liquidity while allowing companies to optimize their balance sheets and fuel continued growth.
Niche aspect of life-sciences and healthcare sector continues to present compelling investment opportunities, particularly in take-private deals and corporate carveouts. We seek businesses strategically positioned to benefit from structural shifts, such as the rise of value-based care, the dynamic evolution of the pharmaceutical value chain, and the rapid advancements in healthcare technology. Furthermore, we believe that the application of AI, particularly through large language models, will fuel LBO activity among established players with valuable data assets.
Driven by localization and regionalization trends, business activity is surging in Europe, North America, and the APAC region, as outlined in our “Outlook 2024 – The Sunny Side of Shifting Currents.” This dynamic landscape, coupled with the reshaping of global supply chains and robust domestic capital markets, presents compelling investment opportunities. While buyouts are gaining traction, we believe these regions remain fertile ground for identifying high-growth companies trading at attractive valuations.
The Private Sector: Filling the Void in a Changing Policy Landscape
The recent U.S. elections have ushered in a new era of policy, characterized by a focus on fiscal restraint and reduced government intervention. This shift creates a significant opportunity for the private sector to assume a more prominent role in key growth areas, including digital infrastructure, low-cost community real estate, space exploration, and retirement savings. Private ownership can often bring greater efficiency, a focus on deadlines, and a stronger emphasis on return on investment. Furthermore, with the increasing strain on government resources, the private sector is well-positioned to address the growing retirement security gap. This dynamic is confined to both United States and Europe partly driven by high public and government debt burdens.
Geopolitical tensions, particularly in North America, support the “New Economic Era” thesis. The US administration’s dismantling of its global influence apparatus (e.g., USAID, etc.) signals an acceptance of multipolarity and the possibility of obsolescence of the post-war order. Tariffs on allies confirm the US’s transition from “indispensable nation” to simply another great power. These policy shifts, though potentially controversial, are likely driven by strategic calculation, not simply poor judgment.
Tariffs on supposed “allies” like Mexico, Canada or the EU; means “U.S. attempt at running the world is over and that there is now just another great power, not the ‘indispensable nation’. This is a massive shift from the old paradigm but don’t be mistaken, America is still a major power.
Cornerstone #2: Regionalization 2.0
Over the next two decades, regionalization and geopolitics will remain a defining force in reshaping the structure and flow of global trade. Five years ago, globalization’s force of hyper-efficiency, driven by complex global supply chains; started unraveling and facing increasing headwinds; with a growing focus on resilience, geopolitics are pushing businesses to shorten supply chains and prioritize regional production. Rising nationalism, protectionism, and geopolitical tensions are leading to a more fragmented world order.
Global Trade & Geopolitics
Global trade agreements are being dismantled thanks to shifting geopolitical dynamics, and countries are prioritizing self-sufficiency over interdependence. This trend is accelerated by technological advancements that enable localized production and less reliance on global supply chains.
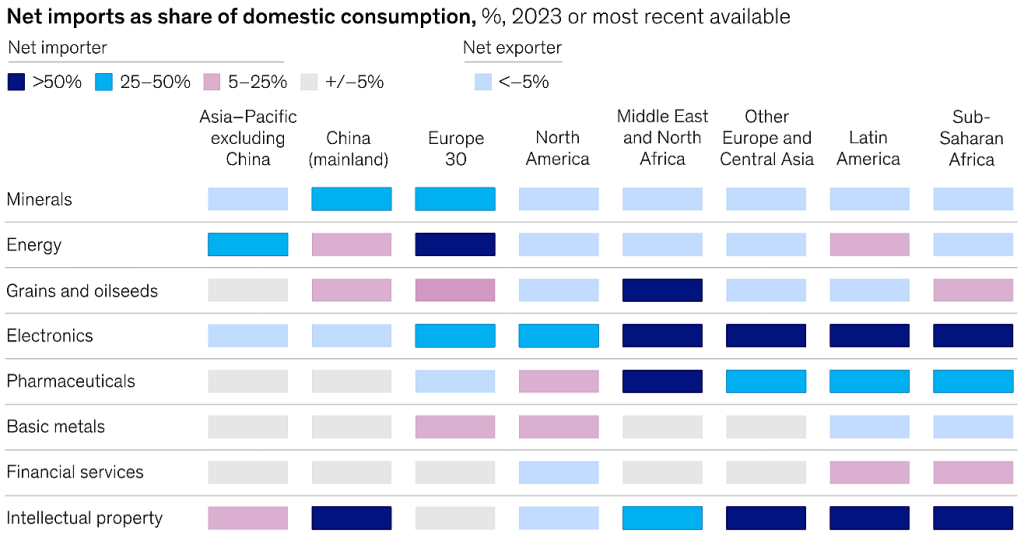
Trade strengthens economies but also creates dependencies which can also turn into vulnerabilities. Across all major regions, imports account for over 25% of consumption in at least one key area, whether it’s critical resources, manufactured goods, or services (Exhibit 32). Even nations with strong export portfolios face supply vulnerabilities. The U.S., for instance, exports more nonfuel minerals than it imports, yet it still relies on foreign sources for over 75% of 30 critical minerals, including rare earth metals essential to technology, advanced manufacturing and national security.
Exhibit 32: All Regions Rely on Trade
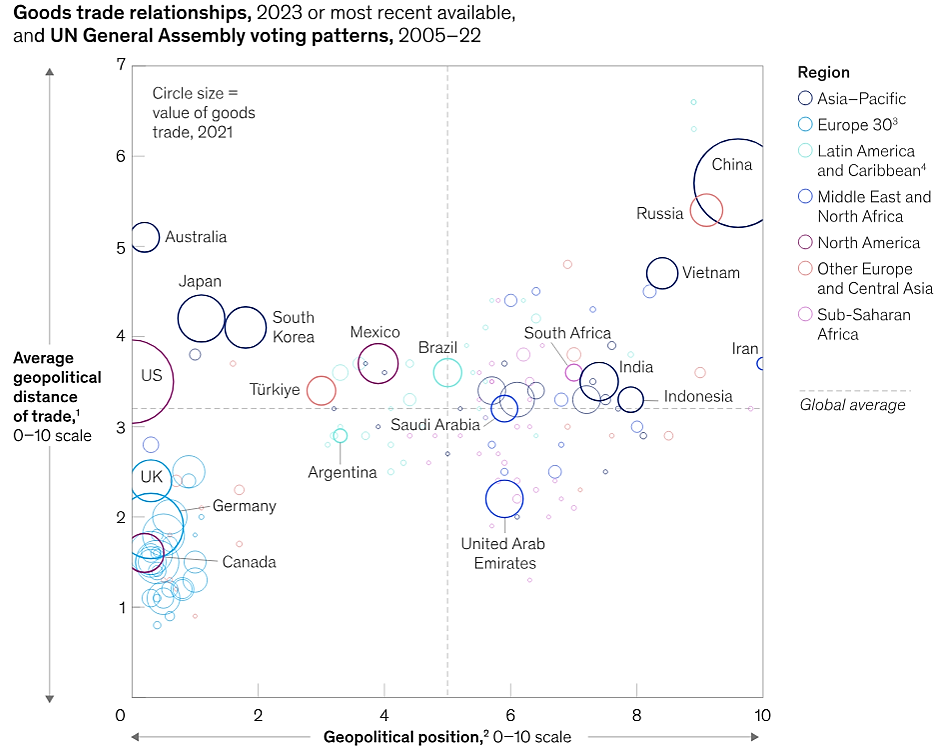
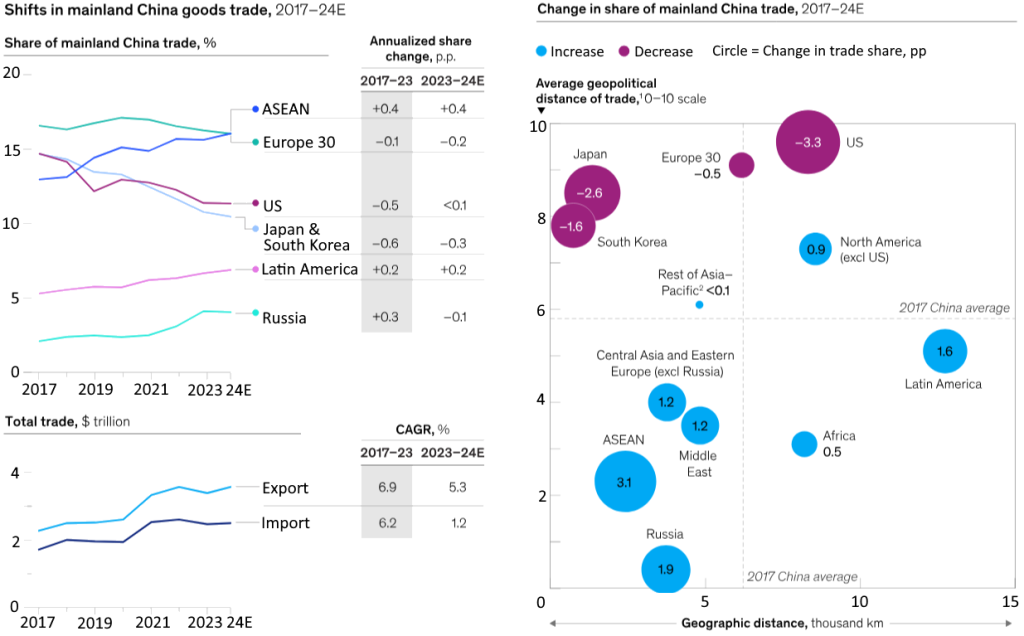
Many of the world’s largest trading economies engage heavily in commerce with partners that hold vastly different geopolitical positions. Notably, China—currently the largest trading economy globally—trades more with distant, geopolitically diverse partners than any other nation. In 2023, transactions with the Europe 30, Japan, South Korea, and the United States comprised around 40% of China’s overall goods trade (Exhibit 33).
Currently, the U.S. and Europe are increasingly diverting trade away from China in favor of alternative emerging market partners. Data indicates global trade is realigning toward closer trusted geopolitical allies, reflecting growing importance of regionalization, friendshoring, and derisking in trade strategies. Nations at opposite ends of the geopolitical spectrum, such as China, Germany, and the United States, have experienced notable declines in trade with one another, reflecting a growing divide in international commerce (Exhibit 34).
Exhibit 33: Many Countries Trade with Geopolitically Distant Partners
Geopolitical tensions, particularly in North America, support the “New Economic Era” thesis. The US administration’s dismantling of its global influence apparatus, signals an acceptance of multipolarity and the possibility of obsolescence of the post-war order. Tariffs on allies confirm the US’s transition from “indispensable nation” to simply another great power. These policy shifts, though potentially controversial, are likely driven by strategic calculation, not simply poor judgment.
– Barry Simon Graham (Group Co-CIO)
Exhibit 34: Regionalization is Taking Hold. Commerce is Now Covering Reduced Geopolitical Distances.
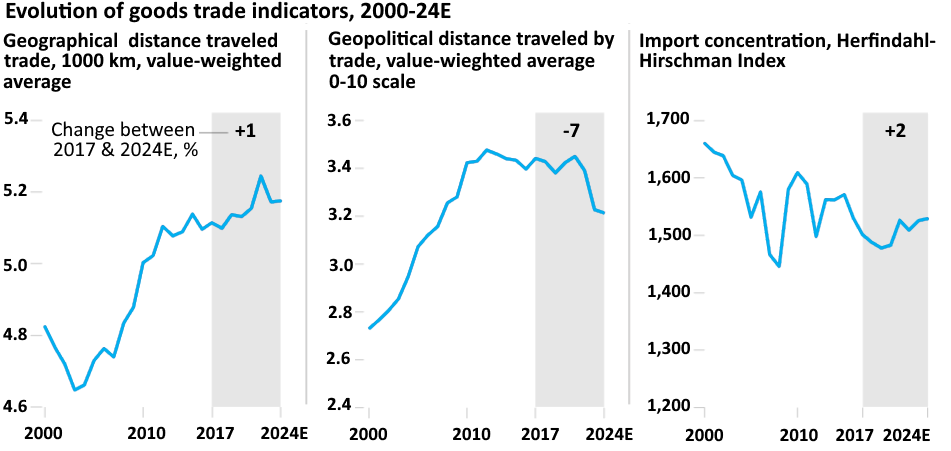
.However, the trajectory and intensity of this global trade transformation vary among the world’s leading economies. While some economies are adjusting their trade strategies based on geopolitical considerations, others, particularly mid-aligned economies like ASEAN, Brazil, and India, have maintained or even increased their geopolitical trade distance. Global import concentration—the degree to which economies rely on a diverse range of trading partners for their imports—has remained stable overall, with no clear shift toward diversification. However, patterns differ across regions. Larger and more developed economies, such as China, Germany, and especially the United States, are showing signs of diversifying their sourcing strategies.
U.S. trade with ASEAN and Mexico is growing as the country diversifies away from China. From 2017 to 2024, China’s share of US imports fell across almost all sectors, most notably electronics, machinery, and textiles/apparel (14%-17% decline, (Exhibit 35). This reflects a U.S. sourcing strategy shift, not a decline in Chinese exports, which have actually increased globally by over $500 billion since 2017.
Developing economies now dominate China’s trade, fueled by increased engagement with regions like ASEAN, Latin America, and Russia. This shift has occurred over the past two years, with developing economies overtaking advanced economies as China’s major import and export partners. Concurrently, China’s trade with more geographically distant nations, including the EU30, Japan, South Korea, and the US, has fallen by almost 10% between 2017 and 2024 (Exhibit 36).
While India pursued a strategy of broader global trade engagement, Brazil increasingly prioritized trade with Asia, especially China. Over the period from 2017 to 2024, Brazil’s exports to China, primarily agricultural goods and metals, grew alongside its imports of Chinese manufactured products; reinforcing a two-way trade dependency.
ASEAN has significantly boosted its imports from China and exports to the United States between 2017 and 2024. This shift highlights the region’s ability to navigate the geopolitical landscape, as its trade ties with both major powers grew stronger. Meanwhile, Europe, Japan, and South Korea saw their shares of ASEAN trade decline during the same period.
Exhibit 35: The Proportion of U.S. Trade Involving ASEAN Nations is on a Consistent Upward Trend.
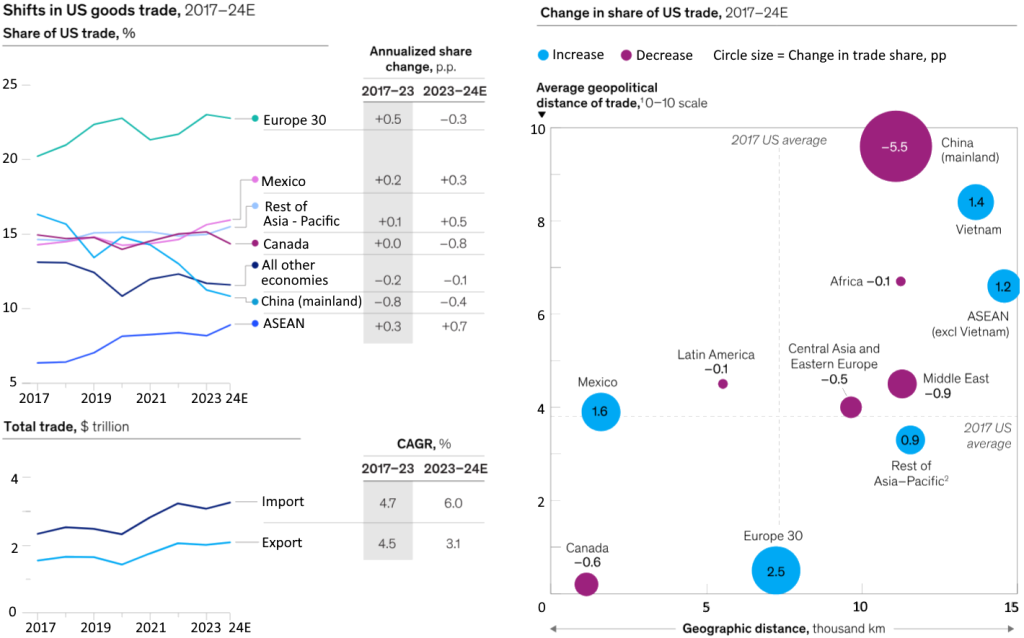
Exhibit 36: China’s Trade Focus has Increasingly Shifted Towards Developing Economies, Notably Within ASEAN.
Implications for Capital Allocation
Reviewing the data, there isn’t a full retreat from global trade, but rather a shift towards regional hubs where sectors or companies source and sell within a more localized sphere. Governments are incentivizing this trend with subsidies and policies that favor domestic or regional production, particularly in strategic sectors like technology and pharmaceuticals.
The new battleground for global economic dominance is no longer just about tariffs but about technology and data control. Regional blocks and countries are imposing restrictions on technology transfer, limiting access to critical data, and investing heavily in developing their own indigenous tech capabilities. This is creating a bifurcated technology landscape, with separate ecosystems emerging in different parts of the world. Considering these developments, what strategic investment opportunities and capital allocation adjustments should global, regional, and national institutional investors consider? How will things unfold in the next two decade? A closer look at the data suggests:
- Focus on Regional Champions: We favor companies that are well-positioned to benefit from the growth of regional hubs, particularly in emerging markets with growing consumer bases. Businesses that dominate regional markets or adapt to localized supply chains will outperform global competitors. Accordingly, diversify geopolitical exposures.
- Advanced Manufacturing, Automation & Robotics: Capitalize on the increasing demand for automation and robotics technologies as companies seek to optimize production in higher-cost environments. Companies specializing in robotics, AI, and 3D printing will benefit from the demand for efficient localized production.
- Sustainable Infrastructure Development: Support infrastructure projects within emerging market regional hubs to facilitate trade and connectivity. Investments in renewable energy and infrastructure to support localized production (e.g., microgrids, logistics hubs) will be critical.
- Resource Security: We are also interested in companies and sectors that ensure access to critical resources like energy, minerals, and food, as competition for these resources intensifies. Commodities and Strategic Resources – focus on industries that secure access to critical resources (e.g., rare earth metals, energy) as nations prioritize self-sufficiency.
- Domestic Focus: Prioritize investments in companies in very large economies with a strong domestic market presence and limited reliance on global trade. The data support our view that sectors like defense, agriculture, and critical infrastructure will benefit from government support and protectionist policies.
- Innovation Race & Strategic Technologies: Invest in companies that are developing critical technologies in areas like artificial intelligence, semiconductors, renewable energy, and quantum computing, as these will be highly sought after by governments – which are at the center of geopolitical competition. The competition for technological leadership will intensify, with significant investments in research and development.
- Data Nationalism, Cybersecurity & Defense: Countries continue to implement stricter regulations on data flows, impacting businesses that rely on cross-border data transfers. We favor data localization solutions; including support companies that provide solutions for data storage and processing within specific jurisdictions to comply with data localization regulations. We find companies specializing in data protection as data becomes a more valuable and contested asset. In addition, we prefer capital allocation to cybersecurity and defense companies as geopolitical risks and cyber warfare become more prevalent.
Final Thoughts
The trends of localization, deglobalization, and Trade Wars 2.0 will reshape the global economy over the next decade, creating both challenges and opportunities. Investors must adapt by focusing on regional resilience, strategic technologies, and sectors that benefit from government support. By aligning capital allocation with these themes, investors can navigate the complexities of this new economic paradigm and achieve long-term success.
3 Real Estate
The past two years have tested the resilience of the real estate sector, but we are encouraged by its growth potential moving forward. Supported by a convergence of economic tailwinds, the sector is showing clear signs of recovery, with bidding activity on the rise. Yet, this next phase will be unlike the recovery following the financial crisis, as it will be shaped by higher capital costs and increasing polarization in performance outcomes.
Interest rate movements and debt availability exert a strong influence on the performance of real estate, a levered asset class. The recent easing cycle marks a potential inflection point; however, real estate prices may not immediately respond to last year’s rate cuts.
Exhibit 37: Developments in Global Residential Real Estate Markets
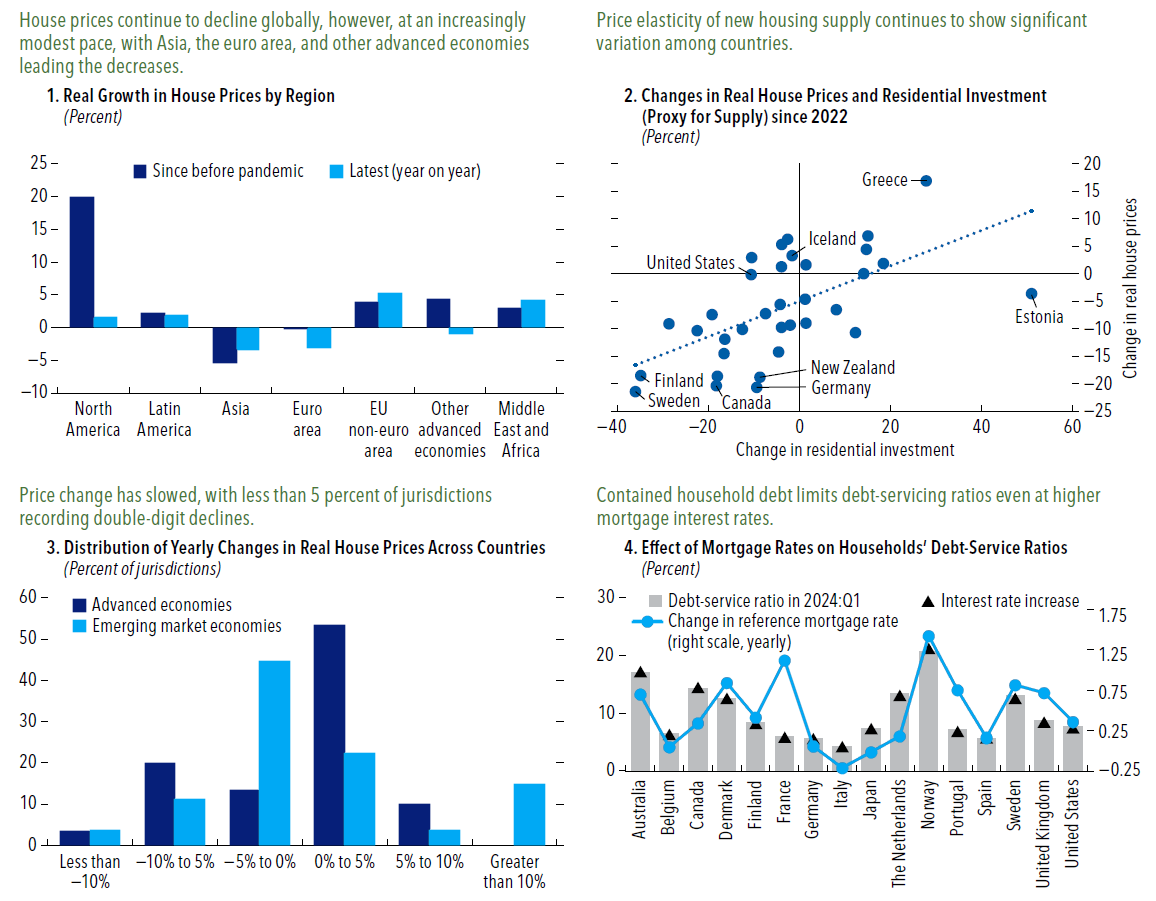
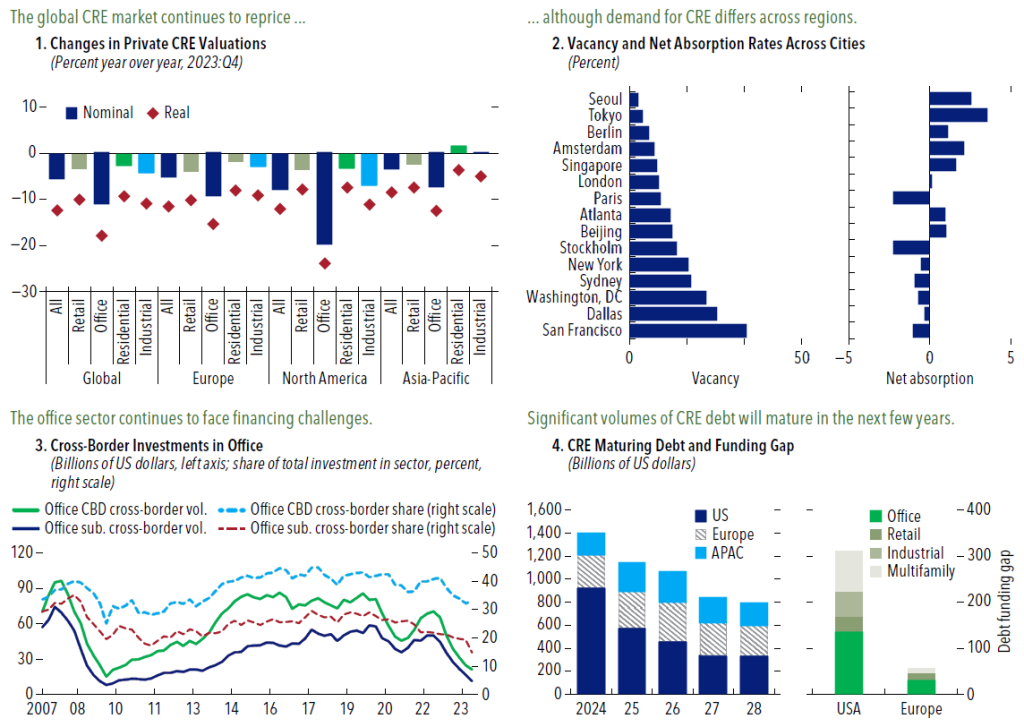
The current real estate cycle has demonstrated greater resilience compared to its predecessors. Despite a relatively stable outlook for residential real estate in much of the world (Exhibit 37), the commercial real estate (CRE) sector presents a cause for concern (Exhibit 38). CRE challenges stem from strong fundamentals in many sectors, driven by a tight labor market across developed economies. This has supported income growth in sectors like U.S. industrials and residential/apartments. Mis-pricings and deteriorating fundamentals are likely to drive further CRE market corrections, particularly in the office sector. This could lead to funding withdrawals, price declines, and increased pressure on both banks with high CRE exposure and nonbank investors like REITs, potentially creating an adverse feedback loop.
Exhibit 38: Developments in Global commercial Real Estate Markets
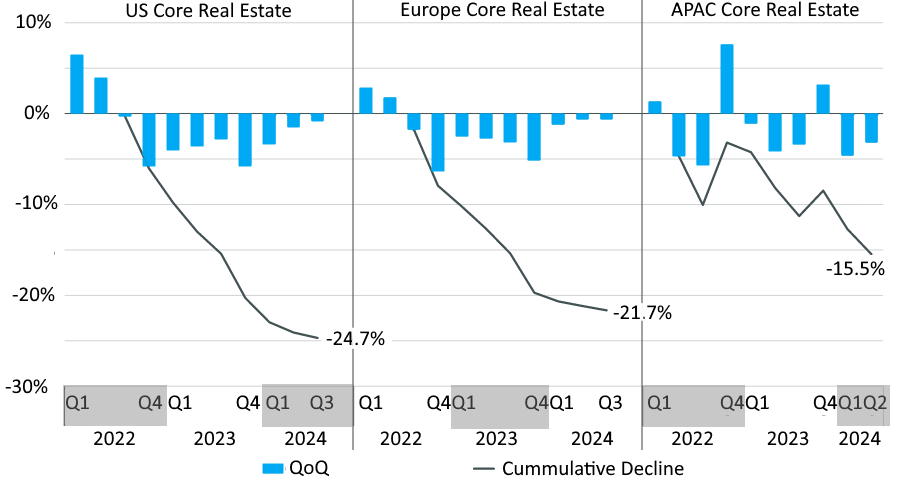
Encouragingly, valuations are improving across our high-conviction sectors, particularly residential, industrial, and logistics. Transaction prices for many key sectors have either stabilized or increased, suggesting that many markets have likely reached or surpassed the cyclical trough (Exhibit 39). While the U.S. office sector remains uncertain and faces the most negative sentiment, many European and APAC cities are demonstrating strong recovery, with occupancy levels largely returning to pre-pandemic levels – reflecting greater resilience.
Exhibit 39: Capital Value Declines In Core Real Estate Offer a Tactical Entry Point; Deploy Capital and Acquire High-Quality Assets at Discounted Prices.
U.S. Real Estate Market
The combination of slow US economic growth and improved real estate fundamentals will support a moderate recovery in real estate investment activity in 2025. Despite the 10-year treasury yield staying above 4%, capitalization rates are likely to compress slightly, creating an opportunity for investors to capture long-term returns that have been rare in the past few years.
The upward trend in the office sector that started in 2024 will gather pace in 2025, leading to a tightening supply of premium office spaces by year-end and signaling a revival in America’s downtown districts. Retail, with its sector-leading low vacancy rates, will witness a surge in activity. Consolidation among retailers persists, but suburban and Sun Belt markets are set to capture growing interest, with institutional investors reentering the fold.
The ongoing expansion of e-commerce will bolster industrial real estate in 2025-6, but leasing activity is set to normalize to pre-pandemic levels (Exhibit 40A, 40B). Older facilities will face higher vacancies as tenants increasingly favor premium spaces. Although tenants currently hold the upper hand, market conditions are expected to tighten by year-end.
After a significant increase in multifamily construction over the past three years, robust tenant demand will push vacancy rates lower in 2025. Economic expansion is poised to boost household formation, with elevated homeownership costs sustaining strong demand for rental apartments.
Exhibit 40A: Slow but Steady U.S. Commercial Real Estate Market Recovery (CRE Investments Volume ($B))
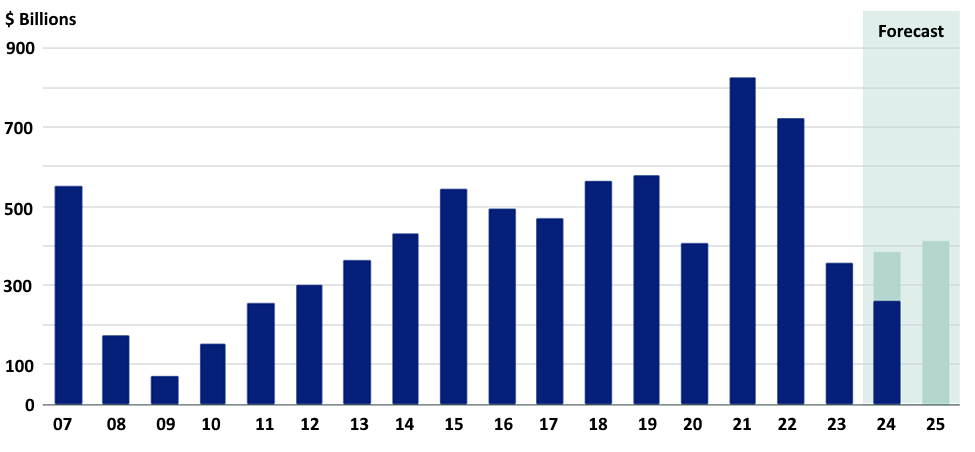
Exhibit 40B: Real Estate Growth Will be Accelerating in 2025

Europe Real Estate Market
The European real estate sector appears set for a slow but steady rebound, underpinned by improving economic conditions (Exhibit 41). Growth prospects are bolstered by rising real incomes and interest rate policies that encourage corporate investments. Investment activity is likely to expand as pricing stability improves, product flow increases, and buyer-seller dynamics converge. Lower capital costs will play a key role in enhancing returns and driving investment growth.
Exhibit 41: Investment Volume in Europe by Sector & Forecast
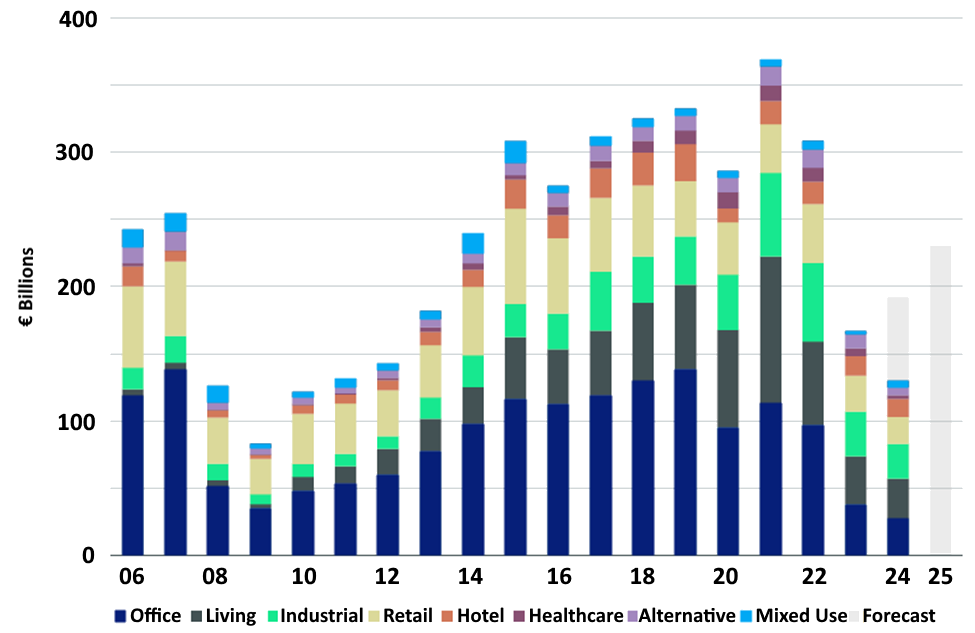
The European living sector has emerged as the largest asset class, a position poised for continued dominance. Our data points to a severe housing shortage, with a projected need for 10 million new homes to meet demand. This shortfall is exacerbated by declining construction permit issuance. Rising rental costs and increased privatization are further straining tenant affordability. Despite these challenges, the build-to-rent and Purpose-Built Student Accommodation (PBSA) markets are expected to remain attractive to investors.
Projections indicate a rise in leasing activity within the logistics sector through 2025, with the second half poised for more robust performance. Stabilizing vacancy rates will accompany ongoing expansion plans, though rental growth may soften in response to changing tenant dynamics. Investor appetite for Prime and Grade A properties, particularly for large-scale assets, remains strong.
The office market is poised for recovery; we are forecasting stronger investment activity as debt conditions improve and lending margins stabilize. Demand for upgrading core-plus and value-add assets to core properties is set to rise. Leasing activity is expected to increase by 5–10% year-over-year, bringing it closer to historical averages. In major cities such as Madrid, Amsterdam, and Warsaw, vacancy rates are showing signs of improvement. Nonetheless, the divide between prime and secondary assets is likely to grow.
Prime shopping centers are on the verge of a transaction revival as the retail market benefits from attractive return prospects. We are seeing improving consumer fundamentals, albeit gradual, combined with robust retailer expansion strategies, are key drivers of steady rental growth. High street properties, retail parks, and prime shopping centers are positioned to excel, showcasing enduring demand for premium retail locations.
The European tourism and hotel industry continues to thrive, with steady progress projected into 2025. If we are right then Greece, France, Italy, and Spain will be standout markets that are well-positioned for higher occupancy and improved average daily rates. International demand, especially from U.S. travelers, is forecasted to underpin revenue growth per room. These factors create an appealing climate for hotel investment, driven by strong return expectations and increased investor focus on the sector.
APAC Real Estate market
While the magnitude of the real estate market correction in APAC has been relatively less pronounced compared to other regions (Exhibit 42), as reflected in appraisal values, select markets still present compelling opportunities. Our data suggests Tokyo, Sydney, and Singapore have emerged as the leading destinations for cross-border real estate investment in the Asia Pacific region in 2025. Their appeal lies in higher returns and the stability of their reliable markets. Meanwhile, India’s economic momentum is driving our interest, with Mumbai and New Delhi securing positions among the top 10 target markets in the region.
Asia Pacific has shown notable improvement in the real estate market, with net buying intentions climbing from 6% in 2024 to 15% in 2025. This shift is primarily fueled by lower debt costs and the repricing of assets. Notably, investors in Singapore and Hong Kong SAR with cross-regional mandates have indicated broad-based net buying intentions. Large landlords in Australia and Korea have also exhibited a significant rise in buying intentions, motivated by attractive pricing in their local markets.
In the Asia Pacific region, industrial properties continue to reign supreme as the most coveted asset class for investors, especially those seeking core investments. Concurrently, office and data center assets are gaining traction in 2025. Within the office sector, investors are increasingly drawn to core-plus and value-add properties, while in the data center market, opportunistic pricing, particularly in Southeast Asia, is driving significant interest.
We continue to actively pursue logistics assets in Japan and Australia, with increasing interest in India. Meanwhile, the office sector is attracting renewed investor attention. This shift is particularly noticeable in markets like Australia, Singapore, and Korea, where stable or growing leasing activity is driving investors back to the office market.
Exhibit 42: APAC Real Estate Investment climate Shows Positive Growth in 2025

The European living sector has emerged as the largest asset class, a position poised for continued dominance. Our data points to a severe housing shortage, with a projected need for 10 million new homes to meet demand. This shortfall is exacerbated by declining construction permit issuance. Rising rental costs and increased privatization are further straining tenant affordability. Despite these challenges, the build-to-rent and Purpose-Built Student Accommodation (PBSA) markets are expected to remain attractive to investors.
– Barry Simon Graham (Group Co-CIO)
4 Private Credit
Private credit, which encompasses lending outside of traditional banking and public debt markets, has demonstrated substantial growth over the past two to three decades (Exhibit 43). This asset class has historically exhibited attractive returns, surpassing many debt markets while maintaining relatively low volatility, particularly in the past 15 years. This robust performance, coupled with the ongoing expansion of the private credit market, suggests continued growth potential for the foreseeable future (albeit with some risks).
Exhibit 43: Overview of Private Credit and Other Traditional Markets and Assets
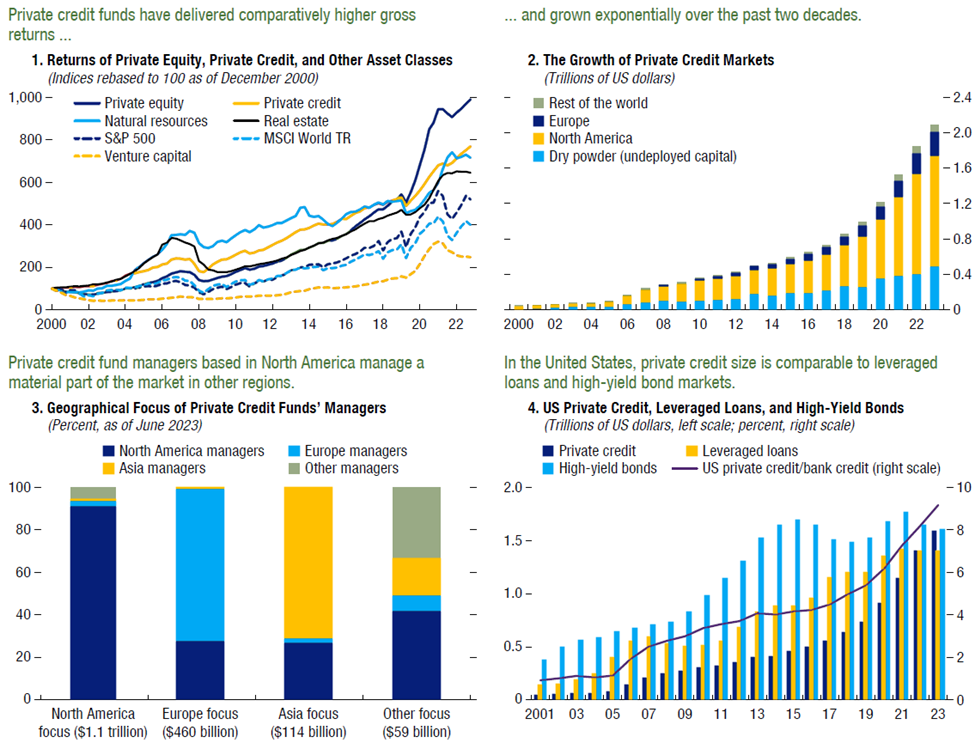
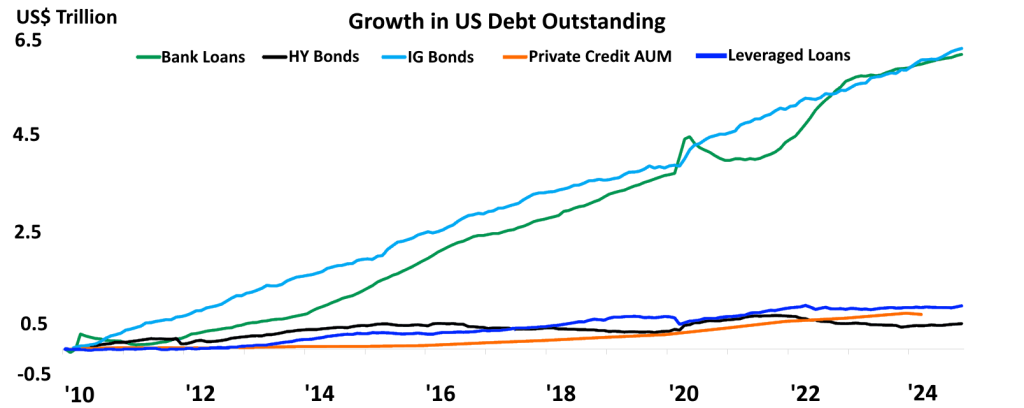
Exhibit 44: Growth of Private Credit Despite Challenges
Challenges & Rising Risks
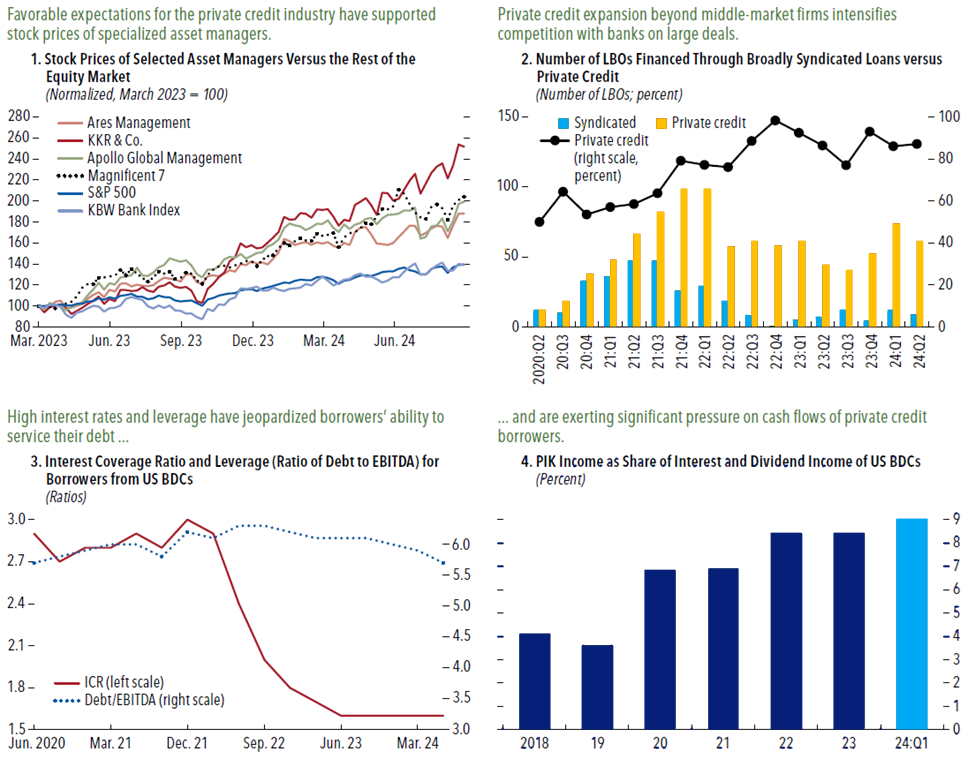
This growth has fueled the success of specialized asset managers, whose market capitalization has outstripped that of banks and the broader equity market. With over $3 trillion in assets, private credit has moved beyond mid-sized companies, increasingly competing with banks in their core syndicated loan market (Exhibit 44.2).
The private credit market, while exhibiting rapid growth, may be facing increasing headwinds. Mounting evidence suggests that rising interest rates are straining borrowers, and the industry’s safeguards or risk mitigation measures have yet to face a severe economic downturn. Concerns are growing that underwriting standards may be eroding due to intense competition, pressure to deploy capital, and the encroachment of banks on larger deals. This erosion, coupled with interest rate pressure, could lead to weaker covenants. Business development companies (BDCs), with their detailed reporting, offer a valuable glimpse into the private credit market. Their data reveals a declining interest coverage ratio (ICR) due to high borrower leverage, floating-rate loans, and the slowing economy, raising concerns about the industry’s resilience (Exhibit 44.3). Private credit floating rate loans, priced 5-10% above SOFR, are lucrative for lenders but increasingly burdensome for borrowers. Higher rates inflate interest income but push companies toward financial stress. Over the past few years, debt servicing costs for many businesses have nearly doubled, testing their resilience.
While traditional defaults (i.e., missed payments) are uncommon in private credit due to flexible loan terms, a broader view reveals growing distress. Restructurings and covenant breaches are on the rise, indicating cash flow struggles. This is evident in the increasing use of payment-in-kind (PIK) coupons (Exhibit 44.4). The private credit industry’s lack of transparency presents significant challenges. It hinders risk assessment and makes it difficult to accurately quantify the impact of loan deterioration. In a downturn, stale and uncertain valuations could mask losses until defaults surge. This creates a vulnerability to crises of confidence, potentially triggered by a wave of defaults within a group of funds. This could lead to a vicious cycle: fundraising freezes, semi-liquid funds face runs, and lenders withdraw support. This “possible” forced contraction across the private credit ecosystem could ripple through other markets and the broader economy.
Cornerstone #3: Finance Reimagined
Our assessment indicates that the addressable market for private credit in America exceeds $34 trillion (Exhibit 45, 46, 47). While direct lending has been the primary driver of growth, fueled by bank retrenchment and PE expansion, the current environment of higher rates and slower PE activity is prompting the asset class to diversify into innovative asset-based financing structures. Concurrently, the pool of capital targeting private credit opportunities is expanding significantly. Retail and insurance investors are contributing substantial inflows. Furthermore, the competitive landscape has become more crowded and intense. Insurance companies, traditional asset managers, and even banks are entering the market directly in greater numbers.
This evolving lending landscape presents both challenges and opportunities for market participants. Notably, banks are facing regulatory changes and increased competition from nonbank lenders. This dynamic accelerates the shift of assets and borrowers from bank balance sheets towards nonbank entities across various segments. This transition opens unprecedented doors for private-credit funds, asset managers, and insurance companies that can build dependable origination capabilities. At the same time, it signals a pivotal shift for banks, pushing them to evolve their business and operational frameworks amidst competition and collaboration with scaled buy-side entities backed by long-term capital. The industry is likely to witness significant shifts, including a separation between asset origination and the subsequent stages of the value chain. This could foster a new wave of collaborations and business models built on open architecture.
Exhibit 45: Private Credit Continues to Diversify into Broader Array of Assets

Exhibit 46: The Global Private Credit Market Stands at Approx.. $1.5 Trillion, With $400 Billion in Dry Powder Awaiting Deployment
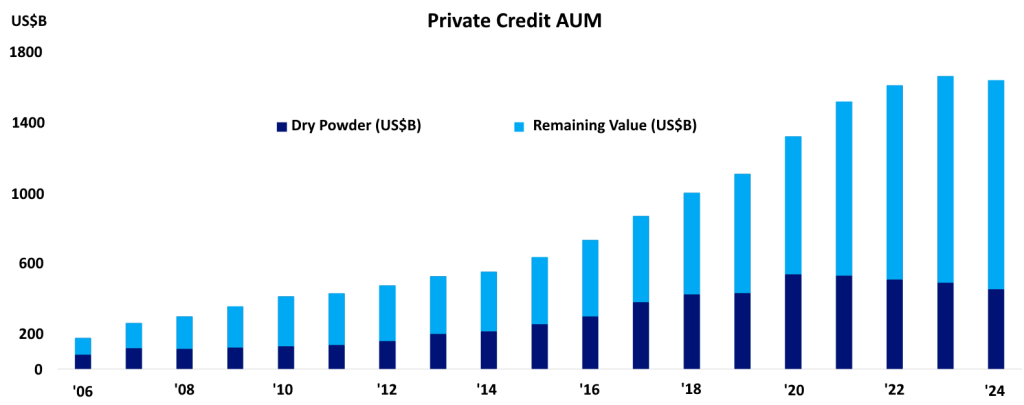
Exhibit 47: Private Credit is Small Fraction of the U.S. Credit Market
The private credit market, while exhibiting rapid growth, may be facing increasing headwinds. Mounting evidence suggests that rising interest rates are straining borrowers, and the industry’s safeguards or risk mitigation measures have yet to face a severe economic downturn. Concerns are growing that underwriting standards may be eroding due to intense competition, pressure to deploy capital, and the encroachment of banks on larger deals.
– Michael Yaw Appiah (Group Co-CIO)
Finance Reimagined: The Opportunities
As private credit continues its meteoric rise, a new era of symbiotic relationships is dawning. Interest entities such as asset managers, banks, and insurers are forging deeper connections, creating an ecosystem that fosters innovation and drives impact. This interconnected web will revolutionize how private credit assets are originated, syndicated, structured, and distributed. If we are correct, we will see four key opportunities shaping this future: a) the diversification of private credit into novel asset classes, b) the emergence of collaborative partnerships and open-architecture platforms, c) the strategic advantage of scale for market leadership, and d) the transformative power of technology in enhancing efficiency and performance.
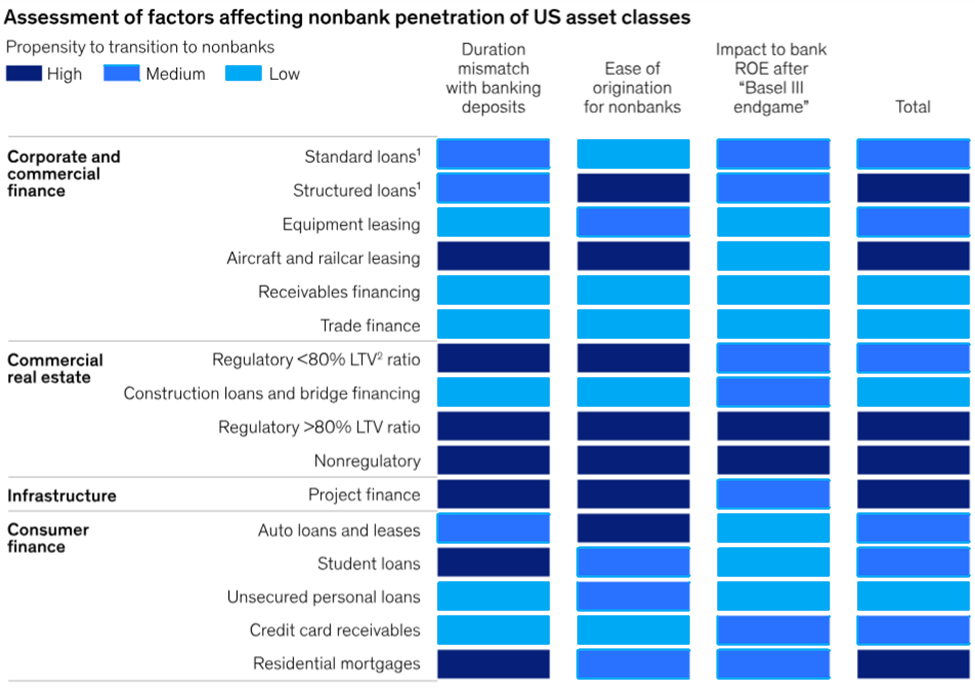
The private credit market is evolving to encompass a broader spectrum of asset classes and borrower demographics. Four specific asset types are emerging as attractive opportunities for nonbank lenders:
- Long-duration infrastructure and project finance assets, typically spanning five years or more.
- Asset-backed finance, featuring higher-yield segments such as equipment leasing and aircraft loans.
- Nonconforming jumbo residential mortgages, especially those with high loan-to-value ratios or associated with secondary residences.
- Higher-risk commercial real estate, where banks are withdrawing from exposures.
These shifts are underpinned by their alignment with key factors encouraging the migration from traditional banking systems (Exhibit 48).
Exhibit 48: Infrastructure, Asset-Backed Finance And Higher-Risk Commercial Real Estate Are Among The Asset Types Most Likely To Transform To Nonbanks
The nonbank financial sector in the United States has the potential to absorb an additional of about $6 trillion in assets within the next decade. This potential is contingent on three key factors: 1) sustained high interest rates compared to the pandemic era, 2) stable performance of yield assets within their historical norms, and 3) the continuation of existing banking regulations.
Unlock Value Through Evolution of Ecosystem Partnerships
The credit market is witnessing a paradigm shift as the traditional ownership model for certain assets evolves. This dynamic presents opportunities for market players to expand their reach into new segments of the value chain. This could lead to the emergence of open-architecture models where loan origination and management can be handled by separate entities, fostering a more interconnected and innovative ecosystem.
1st – Reimagining the Bank’s Role in Credit
To navigate the evolving credit landscape, banks can embrace asset-light models. This involves partnering with asset managers and institutional investors to sell assets, freeing up capital and focusing on core competencies. Banks can maintain client relationships by specializing in loan origination and cross-selling fee-generating services. To facilitate asset transfer, banks can explore various options, such as expanding loan syndication, utilizing forward-flow agreements, actively selling assets, employing synthetic risk transfer mechanisms, and even creating joint asset management ventures. This approach allows banks to remain competitive while adapting to a changing financial landscape.
2nd – Bridging the Gap: Insurers and Origination
Insurers, especially those managing liabilities like fixed annuities, fixed indexed annuities, and pension risk transfers, and holding offshore assets, are increasingly exploring upstream activities. This includes direct origination of private credit assets aligned with their liability profiles. Some insurers are developing their own origination capabilities, while others are collaborating with banks to acquire assets without building extensive origination networks. By strategically increasing exposure to private credit and potentially assuming control over origination, insurers can enhance their general account yields. This allows them to offer more competitive liability pricing and drive higher returns on equity. This approach is especially beneficial for offshore operations due to the reduced capital charges associated with certain private credit assets in those jurisdictions.
3rd – Expanding Reach & Capital in Private Credit
Private credit asset managers, especially those with a head start in the market, have the opportunity to bridge the gap between capital providers and credit-seeking borrowers. By distributing their products to new investor segments, such as insurance companies and high-net-worth individuals, they can expand their investor base and access a broader pool of capital. Furthermore, the strategic acquisitions of insurance carriers and the utilization of offshore reinsurance by alternative asset managers have proven to be effective strategies for securing permanent capital and bolstering their credit capabilities. When these approaches are implemented with a focus on prudent risk management and a deep understanding of investor needs, they can facilitate a more efficient allocation of capital within the real economy. This can result in enhanced financing options for businesses and projects, ultimately contributing to economic growth and development.
Finally, we expect 2025 to present a dynamic investment landscape marked by a significant shift from the post-financial-crisis era. Higher fiscal spending and deficits, coupled with persistently higher inflation and interest rates, will redefine the investing terrain. While numerous policy and economic questions remain unanswered, the growth outlook will ultimately be the most critical determinant for investment success.
U.S. Deficits & Its Global Macro Implications
Beyond Innovation: The Hidden Cost of America’s Economic Outperformance
While the US economy outpaces the “Rest of the World” (RoW) with its greater technological innovation, flexibility and lower tax burden; data suggests the primary reason for its stronger growth lies in an unprecedented fiscal deficit, echoing wartime extremes. This anomaly is paired with real GDP growth above the 10-year average, creating a misleading narrative of robust economic health (Exhibit 49). Albeit not a problem now but could be if US government public debt goes unchecked. Contributing factors include:
- Increased military spending driven by geopolitical tensions, populism, and the polycrisis.
- Ageing populations and escalating public debt, increasing welfare demands and debt-servicing costs.
- Protectionist policies and reshoring efforts that require investment but hinder export-driven sectors.
Exhibit 49: US Federal Spending is on an Unsustainable Trajectory

Reviewing the data, we believe the U.S. economy will continue to grapple with structurally high fiscal deficits (Exhibit 50). The prospect of a meaningful reduction anytime soon appears remote. This will have significant and far-reaching consequences for institutional investors over the coming years and decades. This means fiscal deficits now exert a greater influence on the economy and financial markets compared to the past. During crucial periods, these deficits can even compromise the effectiveness of central bank monetary policies, and restrict their independence in making certain monetary policy decisions.
Exhibit 50: America’s Deficit Expected to Exceed $57T Within 10 Years
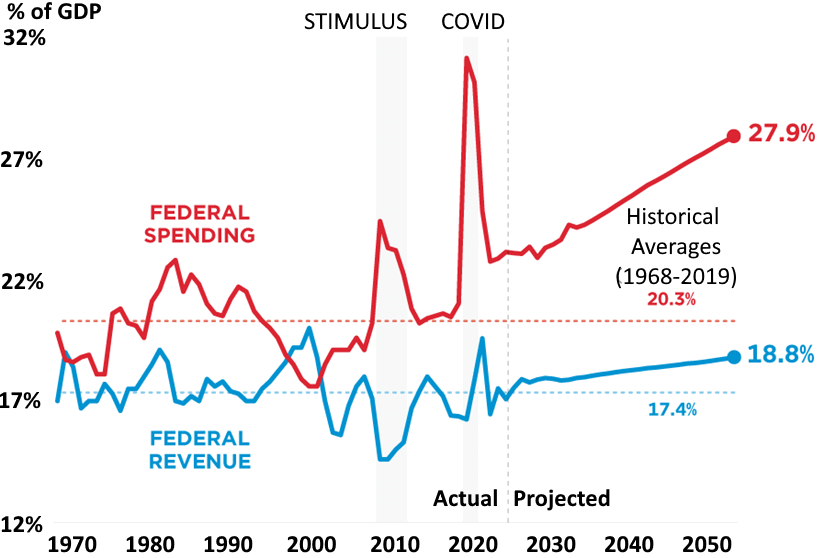
Paradoxically, the US debt rising interest expenses for the past few quarters in from 2022 to early 2024 showed early signs of spurring economic activity more rapidly than the central bank’s rate hikes were restraining the private sector. This counterintuitive effect stemmed from the government’s massive short-duration debt (T-bills), which contrasted sharply with the private sector’s long-term, fixed-rate obligations. Consequently, higher interest rates disproportionately affected the federal government, funneling increased payments into the private economy and indirectly stimulating certain sectors. Despite widespread predictions, the post-pandemic economy has outperformed expectations, while inflation has remained stubbornly high, resisting a return to the 2% target.
Now the question is – Why Do U.S. Deficits Persist? A confluence of factors dating back over fifty years has driven the persistent US budget deficits. These factors are summarized below:
##1: Skewed Social Security –Social Security was designed on the premise of balanced demographics and consistent population growth. Decades ago, the idea of a significant demographic mismatch seemed improbable. However, as America’s population ages and the ratio of workers to retirees diminishes, the system is straining under the weight of its commitments. The once-robust Social Security fund is now depleting and is projected to run out by 2035 (Exhibit 51), jeopardizing its ability to provide full payouts unless reforms are enacted.
Exhibit 51: Social Security Asset Reserves Are Insufficient To Pay Full Scheduled Benefits Throughout The 75-Year Projection Period.
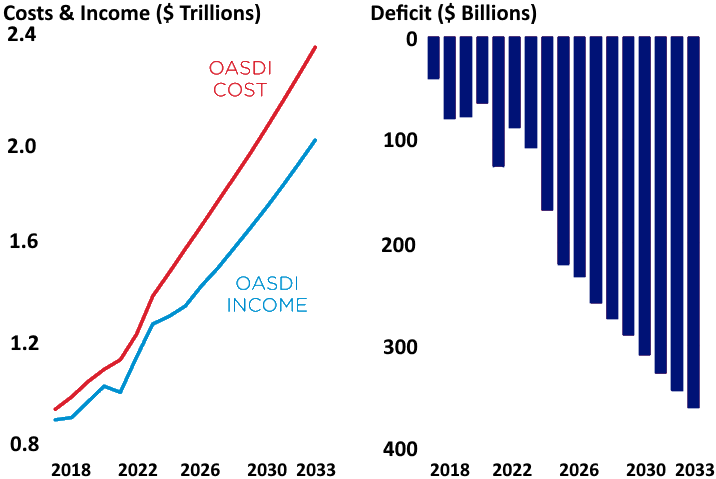

##2: Wasteful Healthcare Expenditure – The U.S. stands as an outlier in global healthcare. Despite spending far more per capita and as a share of GDP than any other high-income nation, the U.S. is the only developed country without universal health coverage. This exorbitant spending fails to translate into superior health outcomes. In fact, the U.S. lags behind in several key metrics: lower life expectancy, higher avoidable death rates, higher maternal and infant mortality, and a high suicide rate. Furthermore, the U.S. struggles with high rates of chronic diseases, including obesity, while simultaneously experiencing physician shortages and limited access to care.
##3: Global Interventionism – Since 2005, America spent $9 trillion for military operations in Iraq and Afghanistan, yielding neither lasting peace nor significant economic benefits. During the same period, China has invested almost $9 trillion to develop cutting-edge technologies and build a modernized national infrastructure. These US activities have accumulated a lot of debt onto U.S. public ledger, contributing to its rapidly growing interest expense.
##4: Compound Interest Burden – For the past four decades, the U.S. has grappled with a rising debt-to-GDP ratio. However, falling interest rates provided a crucial offset, keeping interest expenses manageable. However, with interest rates relatively trending up and moving sideways, the offsetting effect of falling rates is gone. This marks a significant shift in the economic landscape (Exhibit 52). For nations burdened with a debt-to-GDP ratio exceeding 100% faces a stark dilemma. One path is to maintain artificially low interest rates, even during inflationary periods. This strategy, while potentially avoiding a fiscal crisis in the short term, inevitably devalues the currency, harming both citizens and bondholders. Japan serves as a stark example of this approach, having long embraced huge fiscal deficit. The alternative is to raise interest rates when necessary to combat inflation. However, this can lead to a vicious cycle of rising interest expenses, further exacerbating the debt burden and potentially pushing the country towards a fiscal crisis.
U.S. authorities are banking on productivity growth to mitigate price inflation. The economy is not static; it experiences ongoing improvements in technology and organizational efficiency. This leads to a gradual increase in productivity, which offsets some of the inflationary pressure that would otherwise arise from a growing money supply. Thus, we measure price inflation against this dynamic backdrop of productivity growth, rather than a fixed zero point.
An optimistic scenario suggests robust money supply growth to accommodate government deficits, coupled with sufficient productivity gains from technology, AI and other sources to prevent runaway inflation as measured by the official CPI. However, even if this scenario unfolds, price increases will not be uniform. Scarce goods and services will likely inflate in line with money supply growth, exacerbating wealth inequality between “Haves” and “Have nots”; potentially fueling populist movements and social unrest.
Exhibit 52: Surging Interest Expense Of U.S. Govt Debt Now Exceeds $1.4T Per Year (Now Over $3B Per Day).
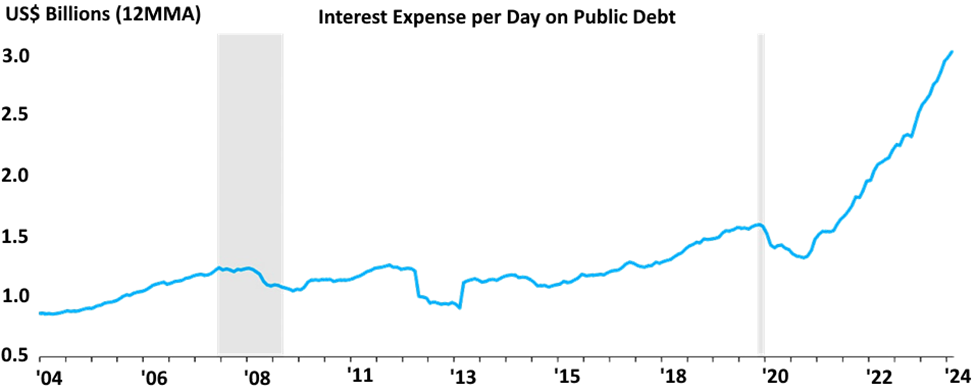
##5: Securitization of Tax Streams – Assuming a highly unlikely scenario where political landscape dramatically shifted, and US politicians miraculously agreed on significant spending cuts or tax increases to drastically reduce the deficit, another major obstacle would still hinder our path to sustained fiscal health.
America’s tax system demonstrates a unique sensitivity to asset prices compared to other developed economies. Stock market performance strongly influences U.S. tax receipts, with revenues typically lagging behind market gains (Exhibit 53). Thus, a strong market performance leads to strong tax receipts in the following year while weak market performance prior year led to weak tax receipts in the subsequent year. This pattern is evident both in absolute terms and when examining year-over-year changes.
Paradoxically, we think efforts to implement fiscal austerity might achieve less deficit reduction than anticipated. The reason lies in their potential to harm stock market performance and asset values, which in turn diminishes tax revenues, offsetting gains from adjusted fiscal policies. But somehow it must be done.
Exhibit 53: U.S. Tax Receipts Are More Closely Tied To Public Equities Asset Prices Thereby Affecting Household Wealth
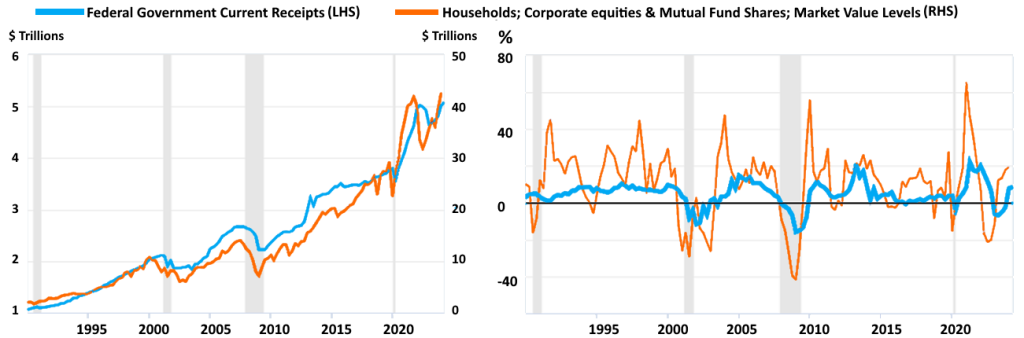
Reviewing the data, we believe the U.S. economy will continue to grapple with structurally high fiscal deficits. The prospect of a meaningful reduction anytime soon appears remote. This will have significant and far-reaching consequences for institutional investors over the coming years and decades. This means fiscal deficits now exert a greater influence on the economy and financial markets compared to the past.
– Barry Simon Graham (Group Co-CIO)
Investing Implications
Given the persistent fiscal strains in certain economies, investors must remain agile in reassessing their market exposure. Critical points to evaluate include:
- Inflation Risk Management: Unsustainable deficits often lead to higher inflation or even hyperinflation as governments resort to printing money or monetizing debt. Institutional investors must prioritize inflation-protected assets like real estate, commodities, or inflation-linked bonds.
- Sovereign Debt Risk: Government bonds, particularly from the deficit-ridden nation, may experience downgrades, defaults, or extreme volatility. Our view is institutional investors should do “select” global diversification, reduce exposure to high-risk sovereign debt, or favor debt issued by more stable economies.
- Global Equities & Multi-Currency Exposure and Currency Depreciation Hedging: Diversifying equity exposure across nations with stronger fiscal economic health provides both capital appreciation potential and currency stability. Global diversification mitigates the risks of domestic economic collapse. Persistent deficits can weaken the national currency due to loss of confidence or trade imbalances. Institutional investors may need to hedge currency risk or focus on assets denominated in stronger foreign currencies.
- Focus on Real Assets – Hard Infrastructure and Real Estate: During periods of fiscal instability, tangible and productive assets like gold, infrastructure, and land tend to retain value better than financial assets. These assets offer protection against both inflation and currency devaluation.
- Shift Towards Alternative Investments & Alternative Strategies: Traditional asset classes may underperform during fiscal crises, pushing institutional investors toward private equity, venture capital, or hedge funds that offer returns decoupled from macroeconomic instability. Hedge funds, distressed asset funds, and private equity offer flexibility and opportunities to capitalize on market dislocations, including debt restructurings or asset repricing during crises.
Navigating the Silver Tsunami: Investing in Retirement Security
With the global dependency ratio climbing, the need for robust domestic retirement savings systems has never been greater. In the U.S., the ratio of retirees to working-age individuals is set to rise from 30% in 2020 to 42% by 2030, reflecting a peaking workforce and growing retiree base for major countries and economies. Many governments are responding by encouraging domestic savings through initiatives like tax-deferred annuities and innovative programs such as Japan’s NISA, UK Individual Savings Account (ISA), Canada Tax-Free Savings Account (TFSA), France Plan d’Épargne en Actions (PEA), Italy Piano Individuale di Risparmio (PIR), Sweden Investeringssparkonto (ISK), Norway Aksjesparekonto (ASK), Denmark Aktiesparekonto (ASK), etc.. Emerging markets like India are also stepping up, aiming to transition savings from traditional assets like gold and real estate into capital market instruments, setting the stage for a global savings revolution.
The changing economic landscape necessitates a re-evaluation of retirement savings strategies. The recent wave of retirements, driven by significant appreciation in housing prices, particularly post-COVID, may not be replicable in the future. Rising housing costs and persistent shortages in developed markets are making it increasingly difficult for individuals to rely solely on home equity for retirement. This necessitates a shift towards more diversified savings vehicles. In the U.S., the percentage of total assets held by the 55+ age cohort has surged from 51% in 2001 to 71% in 2024, driven largely by a fourfold increase in real estate assets. This over-reliance on real estate highlights the need for a more robust and diversified approach to retirement planning.
The traditional reliance on home equity as a primary retirement asset is becoming increasingly untenable. Homeowners must now diversify their portfolios to create more balanced retirement plans, while non-homeowners, burdened by rising rental costs and missing out on home price appreciation, face the daunting task of accumulating significant “catch-up” savings. Achieving these goals will require significant effort and may necessitate government incentives and professional financial guidance.
The intersection of economic and national security is increasingly influencing retirement policy. We expect to witness a growing number of politicians globally advocating for citizens to keep their savings within their own countries. For instance, France policy makers have highlighted the detrimental impact of €300 billion flowing from Europe to U.S. Treasuries, effectively fueling American growth at the expense of European innovation or U.K. policymakers mandating minimum domestic investment levels for pension funds to ensure that tax-advantaged retirement savings contribute more directly to the national economy. This sentiment reflects a broader desire among political leaders to reduce reliance on foreign capital and lower their cost of capital, particularly in countries with significant deficits. This trend is further evidenced by the rise of tax-deferred savings accounts, which, in addition to addressing demographic challenges, can help mitigate concerns surrounding large deficits and reliance on foreign funding.
Cornerstone #4: Labor & Productivity
The global economic landscape is characterized by tepid growth, complex geo-economic tensions, and increasing policy ambiguity. In this environment, institutional investors must ask themselves: how can they not only navigate these shifts but also seize opportunities to drive capital toward economies and businesses that are innovative, inclusive, sustainable, and resilient? Productivity is a cornerstone of global economic expansion, elevating living standards and fostering economic vitality. Yet, in recent decades, productivity growth has nearly stalled, with over half of the global growth slowdown since 2008 linked to this decline (refer to Part A of Outlook 2025).
In the next decade, productivity growth will vary significantly, with its trajectory shaped by technology, skills, labor markets, demographics, finance, regulation, infrastructure, and geo-economic developments. The adoption of breakthrough technologies has repeatedly driven productivity gains, though at varying speeds across industries and regions. In the case of AI, firms in high-income economies perceive its productivity benefits to be nearly 40% greater than those in low-income economies.
Developing human capital is crucial for overcoming the productivity slowdown, particularly because it fuels technological advancement. Globally, nearly half of all firms report a skills gap in their workforce; as a significant challenge.
Evolution of Productivity by 2030
The interplay of two key productivity drivers—technology and human capital—creates four distinct scenarios (Exhibit 54):
Scenario ##1: Productivity Leap: Acceleration of technological and human capital development. This scenario envisions a macro landscape where the synergy between humans and technology becomes the cornerstone of economic growth. New industries, business models, and occupations emerge, reshaping economies and elevating living standards. At the heart of this transformation are managers, entrepreneurs, and workers who harness technology creatively, unlocking unprecedented levels of productivity and prosperity.
Scenario ##2: Automation Overload: Acceleration of technological development, slowdown of human capital development. This is where rapid pace of technological innovation has outstripped the growth of human capital, fostering a “winner-takes-all” economy marked by growing wealth and power disparities. Productivity divides are widening between top-performing firms, sectors, and regions, while a significant mismatch emerges between technological capabilities and workforce preparedness. Automation is transforming critical industries, prompting businesses to invest in cutting-edge solutions to overcome talent gaps and remain competitive. However, while automation drives economic growth, it has failed to improve living standards and has instead intensified social and economic inequalities.
Scenario ##3: Human Advantage: Human capital development outpaces technological advancement, centering economic activity on people. In this scenario, technological advancement has slowed, shifting the focus of productivity growth to human capabilities. Companies are now competing based on their ability to effectively leverage talent across all levels of their organizations. A widespread agreement has formed around the importance of a human-centric economy, with governments and businesses prioritizing technologies that enhance, rather than replace, human workers. However, productivity growth remains uneven. While some firms and economies have successfully utilized enhanced human capital to establish stronger growth trajectories, global GDP and labor productivity growth rates have plateaued, remaining only slightly above their mid-2020s levels.
Scenario ##4: Productivity Drought: Slowdown of technological and human capital development. A concurrent decline in technological innovation and human capital development has stifled productivity growth, leaving economies unable to maintain their earlier levels of prosperity. This has resulted in stagnant living standards and slowed socioeconomic progress. The once-hopeful prospects for a global productivity breakthrough have dimmed, as the dual slowdown in technology and human capital has weakened economic dynamism. Despite widespread acknowledgment of the synergy between human skills and technology as a critical driver of productivity, both businesses and governments have fallen short in harnessing this potential. While isolated advancements in technology and incremental improvements in human capital have occurred, global productivity growth remains uneven. By 2030, global GDP growth has fallen short of early-decade expectations, settling below the projected 3%.
Based on our data-driven analysis, advanced economies—particularly those facing significant demographic shifts toward an aging population—are likely to follow the trajectory outlined in Scenario ##2 and ##3 over the next decade emerging markets, leveraging younger workforces and rapid industrialization, will likely follow Scenario ##1.
Exhibit 54: Four Scenarios for the Future of Productivity in 2030.

Exhibit 55: Industry Exposure by Scenario
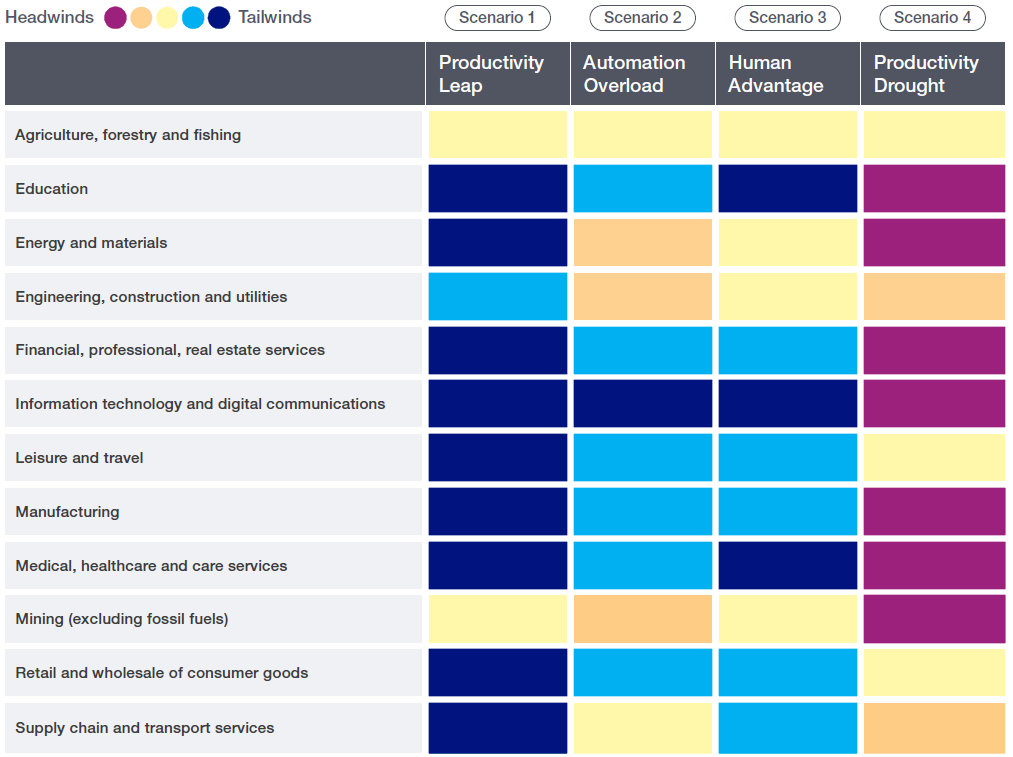
Differentiators – Labor & Productivity:
Success in the next decade will require institutional investors to carefully review data, weighing risks and opportunities while understanding how global trends and sector-specific impacts interact (Exhibit 55). The following differentiators are critical to consider:
Differentiator ##1 – Human Capital as a Differentiator: We continue to favor firms that prioritize human capital development and foster a culture of lifelong learning. As the “Human Advantage” scenario suggests, companies that effectively leverage human skills and creativity will likely outperform those that focus solely on automation. Investors should look for opportunities to enhance talent management, training, and employee engagement within their portfolio companies. Focus on adaptability, creativity, critical thinking, and digital literacy – skills that are harder to automate.
Differentiator ##2 – Automation & Augmentation; Technology as an Enabler, Not a Replacement: While automation offers significant potential, investors should be mindful of the risks associated with over-reliance on it. Instead, focus on technologies that complement and augment human capabilities. We favor firms that are using technology to improve productivity, enhance customer experience, and create new opportunities for their workforce.
Differentiator ##3 – Healthcare & Longevity: The strong performance of “Medical, healthcare and care services” in “Human Advantage” highlights the growing importance of this sector. Invest in companies addressing aging populations, healthcare innovation, and personalized medicine.
In the next decade, productivity growth will vary significantly, with its trajectory shaped by technology, skills, labor markets, demographics, finance, regulation, infrastructure, and geo-economic developments. The adoption of breakthrough technologies has repeatedly driven productivity gains, though at varying speeds across industries and regions.
– Michael Yaw Appiah (Group Co-CIO)
.
.
Ins & Outs
Given the current macroeconomic landscape, we present evaluation of key investment opportunities we favor and potential risks to mitigate, guiding investors toward well-informed decisions.
↑ Shifting to Capital-Light Business Models
A key observation from our analysis suggests the emergence of a powerful trend: the migration of companies towards capital-light business models (Exhibit 56). Part of this trend involves public firms effectively ‘going private’. This shift is characterized by enhanced capital allocation strategies, including aggressive share buybacks and divestitures of non-core, capital-intensive segments. These moves aim to create more sustainable, less cyclical businesses with improved earnings visibility and returns. For investors, this presents opportunities to invest in companies making the transition or to acquire assets these companies divest during the process.
This dynamic has created a burgeoning opportunity for the multi-trillion-dollar Asset-Based Finance market. As companies divest assets, demand for financing solutions for credit card receivables, real estate, and other assets is rapidly increasing. This market, already of considerable scale, is expanding into new sectors such as expanding to new areas like insurance liabilities, offering attractive risk-adjusted returns compared to other credit segments.
Exhibit 56: Capital-Light Business Models Have Consistently Demonstrated Superior Performance Compared To Capital-Intensive Industries, Driven By Lower Operational Costs & Greater Scalability

↑ The Rise of Asia Trade: Investing in a Changing Regional Order
Asia is undergoing a period of significant transformation, characterized by a growing emphasis on intra-regional trade and economic integration (Exhibit 57). The share of intra-Asian trade has surged, reaching 62% in 2021, and we anticipate this trend to continue, potentially reaching 70-75% within the next decade. This shift is further fueled by the evolving geopolitical landscape, particularly the United States’ pivot towards a more inward-looking foreign policy. This evolving regional dynamic presents compelling investment opportunities across key sectors, including transportation, telecommunications (including subsea cables), power infrastructure, data center and energy transmission. Western financial firms previously held a significant share of the region’s overseas lending market, accounting for 70% of such lending before the 2008/9 Global Financial Crisis. The rise of local Asian banks, coupled with the growing influence of non-bank lenders, is further shaping the financial landscape of the region. We anticipate significant growth in both Liquid Credit and Private Credit as this trend gains momentum.
Beyond China, we believe India and top markets in Southeast Asia are poised to significantly benefit from the region’s robust economic growth. Favorable demographics, coupled with the growing trend of multinational companies diversifying their supply chains beyond China, are creating significant opportunities in these markets. The emphasis on supply chain resilience is driving investments in data centers, logistics, and lower-cost manufacturing across Southeast Asia.
Exhibit 57: Intra-Asia Trade Poised to Exceed $1.5 Trillion by 2032, Fueling Regional Economic Growth
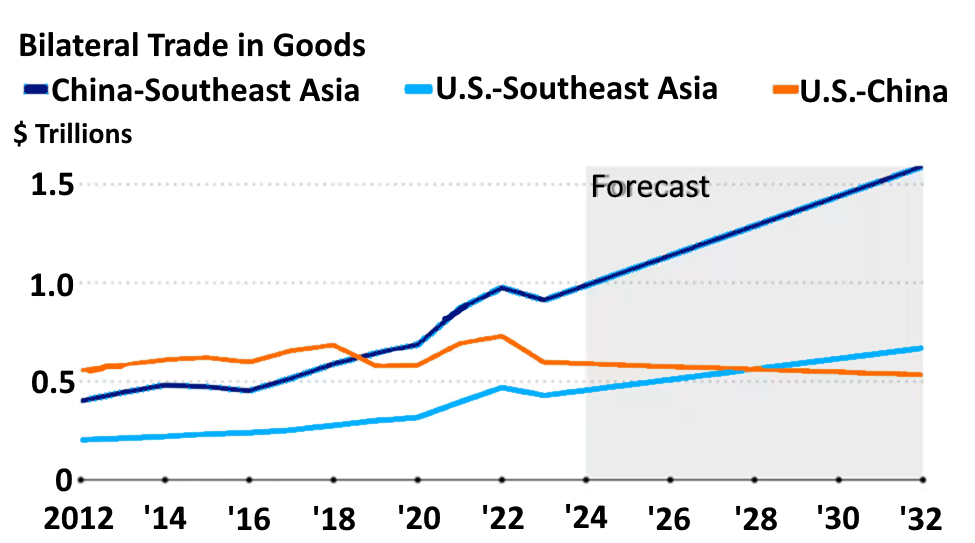
↑ Japan “Net-Nets” Outperformance in the Next Decade
Japanese “net-nets” assets continue to capture our attention, given their compelling fundamentals and proven track record. Historically, these undervalued firms—trading below their net current asset value—have generated superior returns, exceeding 20% CAGR in developed markets during multiple cycles: 1970–1983, 1985–2007, and post-2014 (Exhibit 58). With similar conditions prevailing today, we expect this investment strategy to maintain its strong momentum for the next decade.
For decades, the Japanese market has been dominated by undervalued companies (Exhibit 59). This trend is largely due to poor corporate governance practices, including excessive cash reserves and the prevalence of cross-shareholdings among publicly listed firms, which have historically undermined investor confidence. Corporate reforms are ongoing to reverse trend thereby presenting compelling value proposition (refer to next section for details).
Exhibit 58: Japan’s “Net-Nets” Assets Poised to Outshine Global Competitors in the Coming Years.
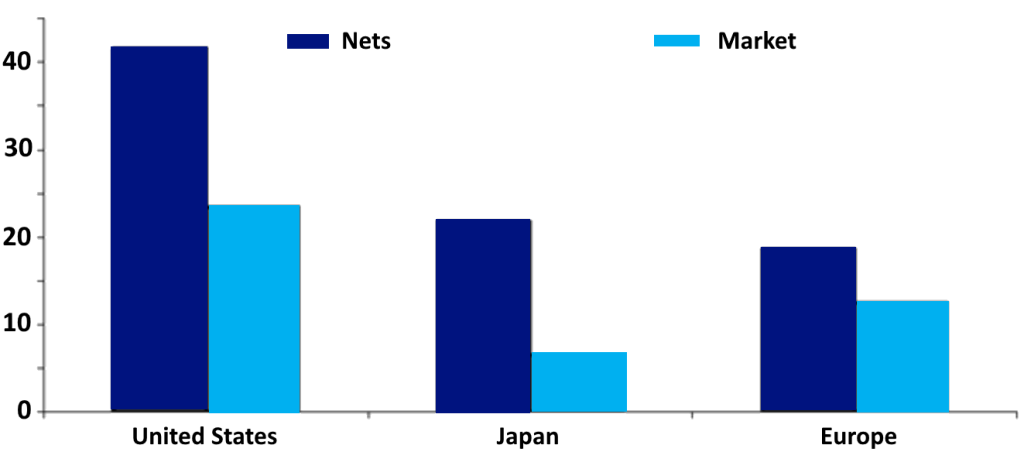
Exhibit 59: Amidst Continued Corporate Reform, Japanese Assets Present a Compelling Value Compared to Global Peers.
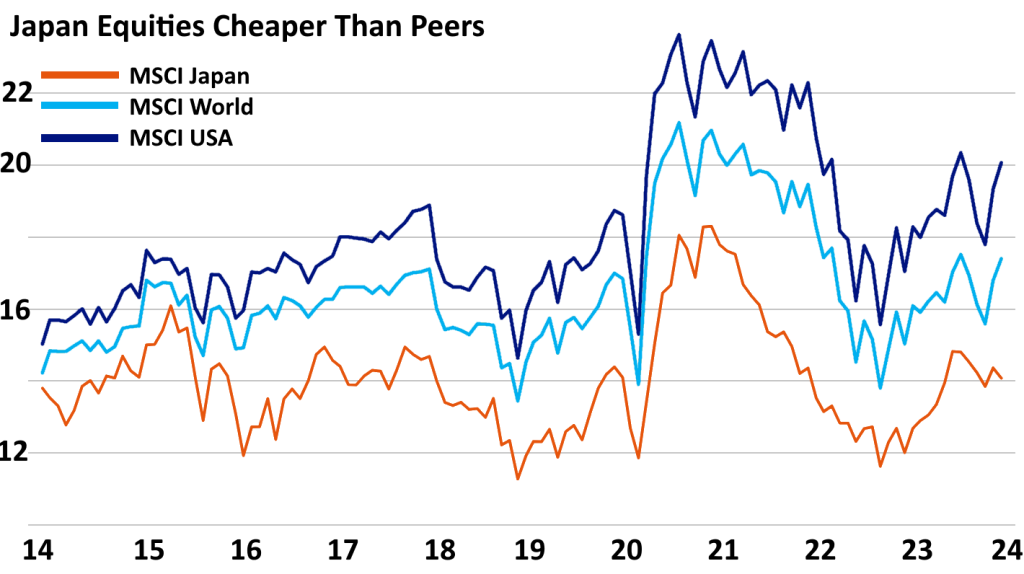
↑ The Unwinding of Japanese Cross-Shareholdings: A Catalyst for Value Creation
Beyond traditional investment avenues like corporate carve-outs and public-to-privates, our recent interactions in Japan highlighted a compelling investment theme: the accelerating unwind of intercompany holdings. This trend, driven by regulatory pressure from the Tokyo Stock Exchange and the Financial Services Agency, is fostering a wave of stock buybacks exceeding JPY10 trillion (USD64 billion) as shown in Exhibit 60, exemplified by Japan Post and Toyota’s recent tender offer. Historically, cross-shareholdings were seen as a pillar of Japanese corporate culture, fostering business relationships. However, these intricate structures often hindered shareholder accountability and weakened corporate governance. As these holdings are unwound, companies are unlocking dormant capital, enabling them to enhance shareholder returns through share buybacks and strategic investments, creating a virtuous cycle of value creation.
Exhibit 60: Japanese Share Buybacks on the Rise
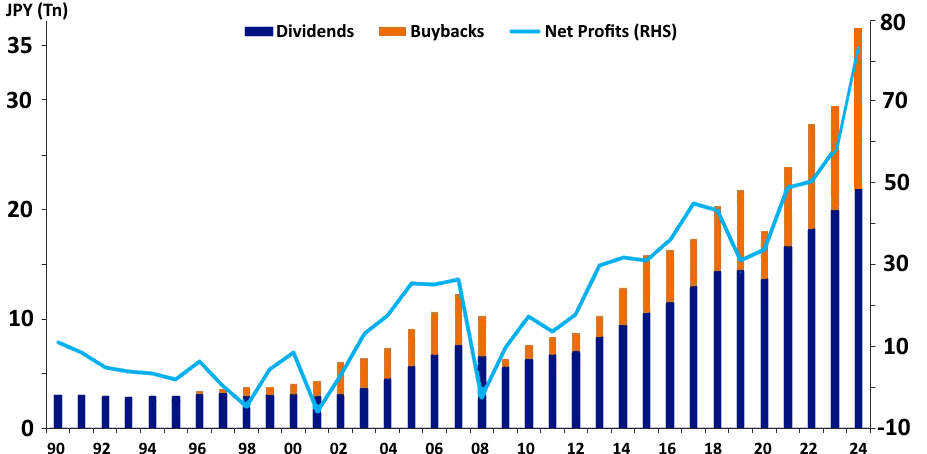
The prospect of rising interest rates has ignited a rally in regional bank stocks. As the Bank of Japan (BOJ) moves towards normalizing its monetary policy, investors anticipate higher interest income for banks, leading to improved profit margins. This optimism is further fueled by a steady increase in outstanding bank loans, which reached JPY549.1607 trillion (USD3.5 trillion) as of November 2024, per BOJ. While the timing of the BOJ’s interest rate hike remains uncertain, the trend towards policy normalization has encouraged investor activity in the regional banking sector (Exhibit 61). This growth in lending, combined with the potential for higher interest rates, is driving expectations for strong earnings growth in the medium to long term.
Exhibit 61: Investor Engagement in Japan’s Regional Banking Sector is on The Rise, Driven by The Country’s Policy Normalization Efforts.
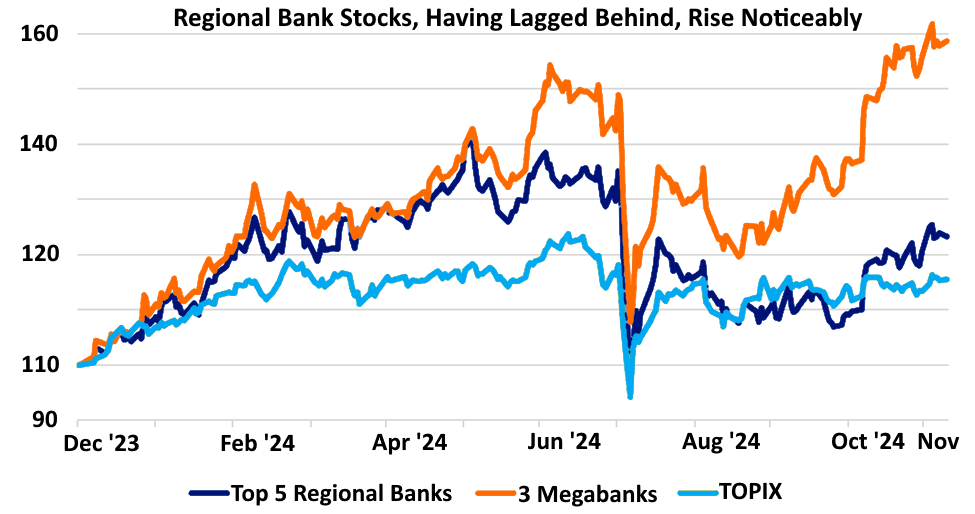
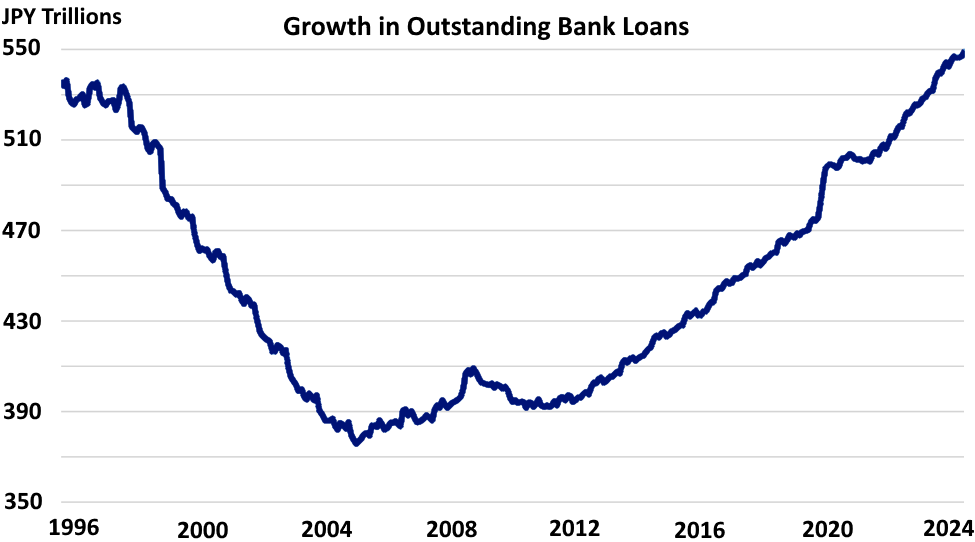
We view Japan’s investing environment favorably, buoyed by signs of an economic resurgence. The recovery is shifting from pent-up post-pandemic demand to a sustainable growth phase driven by real income increases. Elevated capital investments are essential to addressing wage and price pressures while boosting productivity. Corporate carve-outs and public-to-private deals continue to offer meaningful opportunities for operational improvements. Moreover, emerging trends such as inter-company holding dispositions stand out, and investment vehicles like those provided by Zinqular research team offer efficient ways to participate in this corporate transformation.
↑ Biotechnology: A Sector Undervalued Amidst Market Volatility
We believe the current market pessimism surrounding biotech stocks is excessive. While the Nasdaq Biotech Index has experienced a significant decline (20%) from its 2021 peak, this underperformance pales in comparison to the broader market’s gains. The S&P 500, for instance, has surged by a similar percentage during the same period. Despite this, we remain firmly convinced that biotechnology presents one of the most compelling long-term growth opportunities. This conviction stems from several key factors:
- Increased Technological Investment: Continued advancements in areas like gene editing, AI-powered drug discovery, and personalized medicine are driving innovation.
- Aging Demographics: The global population is aging, increasing the demand for healthcare solutions and creating a favorable market for biotech companies.
- Industry Consolidation: The recent challenging environment has led to the consolidation of weaker startups, improving the overall health and competitiveness of the sector.
While concerns about healthcare policy and regulatory hurdles persist, we believe these will be mitigated by the growing emphasis on “reshoring” biotech production and the recognition of the sector’s critical role in national security.
Furthermore, current valuations, particularly in terms of price-to-book, are approaching levels last seen during the Global Financial Crisis, presenting an attractive entry point for investors.
↑ Capital Solutions & European Credit: Compelling Near -Term Opportunities
Near term European high-yield (HY) credit offers a compelling opportunity, and is relatively a ‘bargain’ compared to U.S. HY on a spread basis. With a significant portion (approx. 45%) of European HY maturing by 2026 (Exhibit 62), and future ECB rate cuts on the horizon, investors can benefit from shorter maturities exit strategies. High-quality senior secured assets in Europe present attractive convexity, especially for issuers seeking to refinance short-term debt under favorable conditions. This environment also supports Capital Solutions, as firms and businesses prioritize alternatives to raising common equity.
Exhibit 62: A Large Share of European High-Yield Bonds Are Set to Mature in the Next 3-5 Years, Offering a Major Refinancing Opportunity
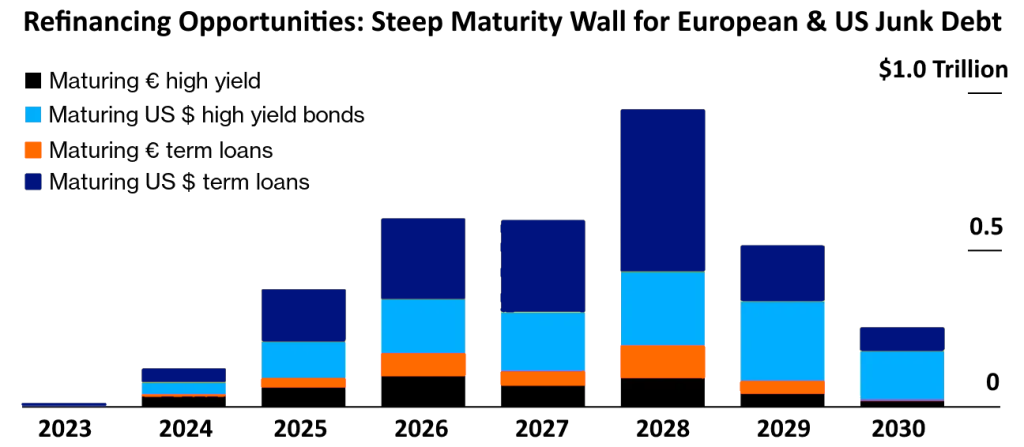
↑ Inflation Protection with Real Asset: Collateral-Based Cash Flows
Despite the growing need for inflation protection, many institutional investors are underexposed to Real Assets specifically Infrastructure, Asset-Based Finance, Real Estate Credit, and segments of Energy. These assets stand out due to their intrinsic inflation hedging characteristics. Backed by tangible assets or benefiting from floating-rate structures and pricing escalators, they offer both stability and upside in a rising rate environment.
Amid the AI revolution, much focus has been on semiconductors. However, the energy demands of these models highlight gaps in existing infrastructure. We are optimistic about investment prospects in energy transmission networks, state-of-the-art data centers, and efficient cooling solutions to bridge this critical gap. Within the evolving Credit landscape, our “New Economic Order” proposition leads us to strongly favor Asset-Based Finance. This asset class presents a significant market opportunity, with lending volumes exceeding $6.1 trillion, substantially larger than High Yield, Levered Loans, and Direct Lending combined. The potential for attractive absolute returns in Asset-Based Finance compared to other Credit sectors is currently highly compelling. Even with anticipated cooling inflation and a potential Fed easing cycle, we maintain our view that interest rates will remain elevated for an extended period.
↑ Uranium: A Strategic Play on the Nuclear Renaissance
Our internal assessment suggests nuclear energy is poised for significant growth as nations increasingly recognize its crucial role in mitigating climate change. To capitalize on this trend, we are strategically allocating capital towards Uranium. The global nuclear landscape is experiencing a resurgence, with over 70 reactors under construction and 350 more in planning stages (Exhibit 63A, 63B, 63C). This surge in activity, coupled with a growing structural supply deficit and increasing geopolitical competition, presents a compelling investment opportunity.
China has expanded its nuclear power capacity at the fastest rate of any country in the 21st century and despite a moratorium on inland nuclear plants imposed after the Fukushima disaster, China is building enough capacity to overtake France within the next few years and hold the world’s second-largest nuclear fleet. Nearly half of the world’s nuclear power under construction is located in China. Its government has promoted nuclear power to shore up baseload capacity in the electricity sector and to help achieve its targets for carbon peaking before 2030 and carbon neutrality by 2060.
Notably, China’s ambitious nuclear power expansion plans, involving 150 new reactors and a $500 billion investment, will further tighten the Uranium market. This unprecedented scale of construction underscores the bullish outlook for Uranium as a critical component of the global energy transition.
Exhibit 63A: Annual Average Nuclear Power Capacity Additions By Scenario, 2010-2035.
Exhibit 63B: China Plans for Ambitious Nuclear Energy Expansion
Exhibit 63C: China Could Soon Overtake France on Nuclear Power Capacity, With Projects Expected to Come Online in Next Few Years
↑ Undervalued Gems Beyond the Technology Titans in a Concentrated Market
While the ‘Magnificent Seven’ have enjoyed a significant rally driven by AI advancements, a group of high growth secular compounders high-growth companies outside the technology sector have been left behind. Secular compounders are firms that demonstrate consistent, long-term growth in revenue, earnings, and cash flows, regardless of economic cycles. These businesses often have durable competitive advantages (moats), strong pricing power, and the ability to reinvest profits at high rates of return.
They tend to outperform over extended periods due to their ability to compound value steadily. These companies, which demonstrated strong outperformance between 2017 and 2023, now trade at a significant discount of about 60% to the market on a next-twelve-month price-to-earnings basis (Exhibit 64). This undervaluation presents a compelling opportunity for investors seeking value beyond the current tech-dominated market. Despite the recent underperformance, these companies maintain strong competitive advantages and the ability to reinvest capital effectively, making them attractive long-term investment prospects.
Exhibit 64: Secular Ex-Tech Compounder Present Compelling Opportunity in the Near Term
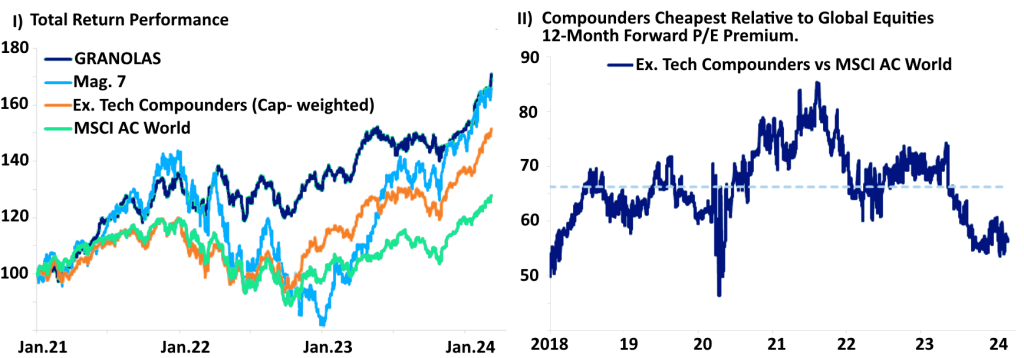
↑ Comprehensive Security: Resilience Across Industries & Nations
This theme continues to dominate our focus as firms face rising cyber threats, geopolitical risks, and disrupted supply chains. Political & industry leaders are doubling down on efforts to optimize corporate security and build resilience across vital sectors like energy, pharmaceuticals, and transportation. The financial industry is amplifying cyber protection post-2023 breaches, and climate concerns are reshaping storage and power needs. Industrial policies such as the Inflation Reduction Act (IRA) in the U.S. and expanded defense investments signal long-term support for initiatives that enhance security and safeguard supply chains globally.
↓ Challenges Ahead for Low-Cost Consumer Discretionary Spending
Inflation pressures, particularly on necessities like food and housing, continue to strain discretionary budgets of younger and lower-income European and U.S. consumers. This group is shifting away from categories like fast-casual dining due to increased competition for housing and employment from immigration trends. Despite signs of broader consumer recovery post-2022, we are reserved and vigilant about spending on non-essentials, especially products with low margins and ties to higher tariffs on Chinese goods. Limited wage growth among low-income earners suggests a faster pullback on discretionary purchases.
↓ Navigating Near-Term Oil Price Headwinds
While we project headwinds next 12 months due to potential headwinds from global tariffs, strong U.S. dollar and a persistent market surplus, our near-term oil price forecasts are slightly below current futures pricing (WTI forecasts for 2025-26). However, we remain optimistic about the longer-term outlook. Prolonged low prices could curb supply and stimulate demand, while geopolitical risks, a sometimes-chaotic energy transition, and a more disciplined approach to capital returns by producers offer potential upside in 2027-28/9.
↓ Decoupled Cycles & the Rise of FX Risk
History suggests currency markets are underestimating the potential for significant volatility in 2025. We see a growing disconnect between market expectations and potential FX volatility. Implied volatility for major currency pairs remains subdued, despite elevated implied volatility for U.S. interest rates. This implies a market belief that interest rate differentials will remain relatively stable across major markets and regions as central banks collectively address similar economic challenges. However, we believe this assumption is flawed. We foresee a ‘decoupled’ economic cycle unfolding, particularly due to the escalating threat of more aggressive tariff policies. This could fuel inflation in the U.S. while simultaneously dampening growth for exporters like Europe and China. In conclusion, we advise against taking on unrestrained FX risk, as currency volatility may become the major market theme in 2025, mirroring the prominence of ongoing bond market volatility since 2022.
↓ Sub-Investment Grade Credit & Non-Controlling Equity Stakes
The evolving macro landscape of slower nominal growth is anticipated to moderate pressure on bond yields, creating a more favorable capital market activity. However, numerous firms with precarious capital structures will need to refinance in the coming quarters. Consistent with our “Getting Back to Basics” 2023 outlook, we advocate for a disciplined approach that prioritizes quality over yield. We believe the incremental yield advantage in lower-rated, unsecured High Yield bonds is not justified by the associated risks. In this context, we expect a substantial differentiation between control and non-control equity stakes. Achieving success in this environment will require a deep focus on operational enhancement and the ability to strategically adjust capital structures, even as credit markets improve.
↓ Uncollateralized Credit
Zinqular analysis indicates a distinct prioritization of consumer spending, with non-prime borrowers prioritizing essential expenses (mortgages, cell phone bills, etc.) over discretionary spending, such as unsecured loans. This suggests potential vulnerability in unsecured credit portfolios. Notably, our benchmark assumes a relatively mild increase in unemployment compared to historical cycles – a projected 200-basis point increase versus historical averages of 350-500 basis points. However, we believe that some lenders may have adopted overly lenient underwriting standards during the recent period of elevated consumer spending. As we progress through 2025, the impact of this potentially lax underwriting is likely to become more apparent, particularly for unsecured credit products lacking direct collateral.