

Authors: Barry Simon Graham (Group Co-CIO) and Michael Yaw Appiah (Group Co-CIO)
In spite of the turbulence across the global economy, our macro take this cycle is phenomenally different; which is to “stay calm and go back to basics”.
“Avalanche” of unparalleled events in 2022 led to steep losses in almost all asset classes across the global economy. Assets, sectors and industries had record price reset especially in public markets. For instance, in private markets there was mega-combined drop of the world’s sovereign wealth funds (SWF) & public pension funds (PPF). For the first time ever SWF and PPF lost USD 2.2 trillion. Value of assets managed by SWFs fell to USD 10.6 trillion from USD 11.5 trillion, while those of PPF dropped to USD 20.8 trillion from USD 22.1 trillion. Out of the 455 SWFs & PPFs with combined assets of USD 32 trillion, some had a terrible year with 45% plunge that led to a loss. The level of losses is consistent across board for top global SWF & PPF (Exhibit 1).
Reviewing the data, we think total losses across the three major asset classes of public equities, bonds, and real estate will be between USD 33 to 39 trillion in the U.S. alone, including about USD 19 trillion in stocks and approx. USD 7 trillion in bonds. Meanwhile real estate losses is rolling; losses in U.S. stocks have been over USD 10 trillion and in bonds over USD 5 trillion, in addition to an unexpectedly large loss of USD 2 trillion in cryptocurrency. Certainly, a decent chunk of the losses we largely forecast in a series of publications in 2022, have largely already occurred (Exhibit 2, Exhibit 3, Exhibit 4, Exhibit 5).
All this happened while investors and economists were coming to terms of the effects and lessons learnt of the impact of the pandemic, unprecedented monetary policy actions, Europe’s energy supply challenges and heightened geopolitical events (e.g., China/ Taiwan, (Europe; NATO; G7; Ukraine) / Russia tensions).
In short, we have entered into a new economic order, where structural forces now warrant a different approach to portfolio construction. The 2022 Bond Market “Bloodbath”; the setup for the bond market entering 2022 (low rates, rising inflation, tightening Fed) was a powder keg just waiting to explode; and “explode” it did. What is so challenging today for macro investors and allocators of capital alike is that the traditional relationship between stocks and bonds – where bond prices rise when stock prices fall – has broken down. The volatility relationship between stocks and bonds will calm in 2023. Looking ahead, we are now firmly of the view that the macroeconomic narrative will soon shift from a singular focus on the impact of inflation on the global capital markets to one where investors are surprised by how unwelcome inflation adversely affects corporate profits.
We are thinking something bold but quite simple – a strategic blue print that takes advantage of long-term “bird’s eye view” across Zinqular’s asset classes and regional markets. The foundation of which is “to go back to basics” in our asset allocation strategy in the next few cycles.
The un-usual but necessary global central bank interest rates rise has in many situations brought irresistible total return opportunities across global financial markets without overexposure to risk and leverage, tacit in our strong opinion is that now is a suitable time to incline towards collateral-based cash flows such as Infrastructure, Real Assets, and many parts of Asset-Based Finance (e.g., Real Estate Credit, Private Credit, etc.). In addition, portfolios in the area of liquid Credit are attractive after the recent panic fire-sale.
Our view with Equities, is to change from large market cap. technology names in preference to small market cap., stocks with much attractive valuation characteristics. Past events shows that 2023 could be a terrific year for Private Equity to begin making serious investments. The U.S. dollar strength is retracting, which suggest that a good-mix of international assets will be examined.
With implications ranging from economic growth, inflation, central bank policy and interest rates to credit quality, earnings, valuations, investor sentiment and other key metrics, we have been warning for quite some time that we will see a ’unusual kind of recovery‘, and that investor community should ‘tread and not rush and be guided by the basics’ and first principles when it comes to capital deployment, specifically as the stock and bond correlation will be getting better. Regardless, the macro environment is quite difficult, but we now feel more emboldened as we think about deployment in 2023.
Exhibit 1: Combined World’s Sovereign Wealth Funds (SWF) & Public Pension Funds (PPF) for the 1st Time ever lost USD 2.2 Trillion for 2022.

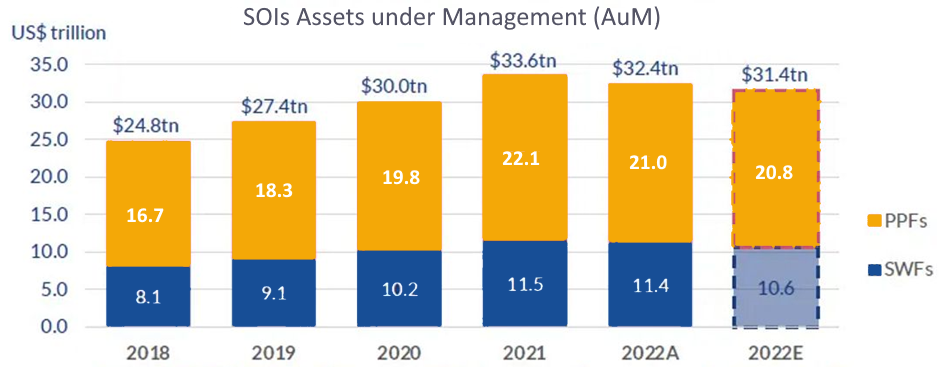
2022E: Global SWF’s Estimates year-end figures
Source: Zinqular Insights, Global SWF Tracker (02 Jan 2023)
Exhibit 2: Commodities and Cash Did Quite Well in 2022. Among the major asset classes, only Commodities and Cash (Treasury Bills) ended 2022 higher. Asset Class Total Returns Since 2011

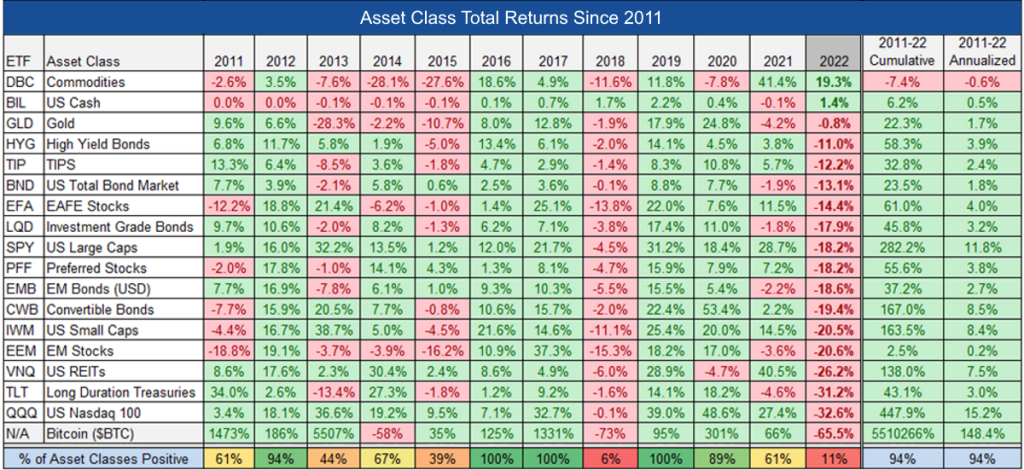
Exhibit 3: In 2022 Total Returns Per Countries (in USD) Were Unbelievably Bad.

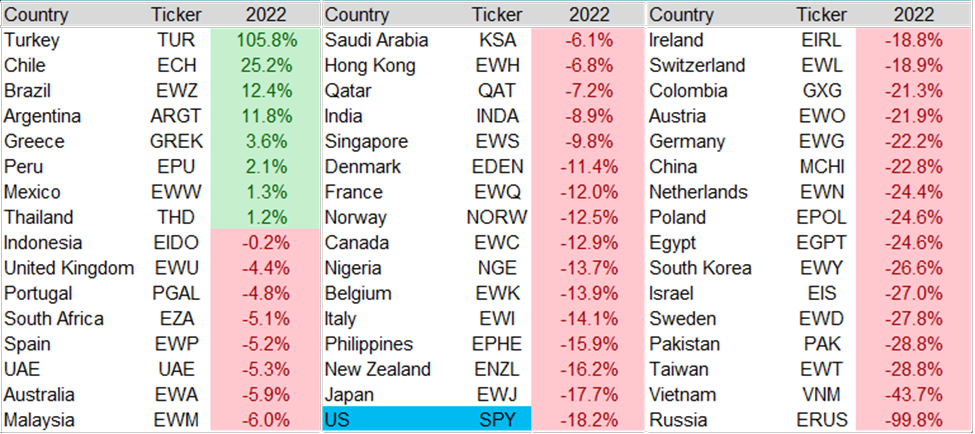
Source: Creative Planning, Data from YCharts (31 Dec. 2022)
Exhibit 4: The Upside of Downside While sentiment is much more negative today than a year ago, long-term investors are actually in a much better place. This is because every major asset class has seen an increase in yield. That’s the upside of downside.

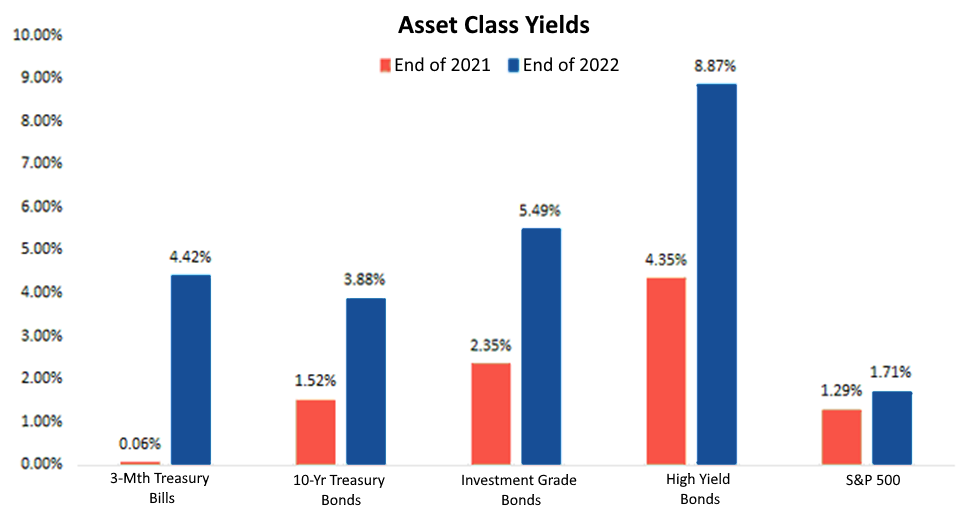
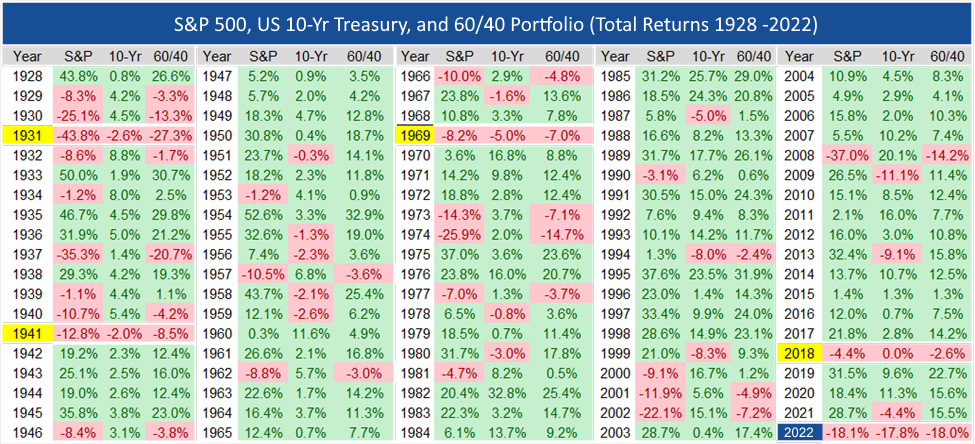
Exhibit 5: 2022 Was the Worst Year for 60/40 Portfolio, S&P 500 & 10-Year Treasury Bond Since 1941. The First Time these Assets Fell More Than 18% in a Calendar Year.

We will see a ’unusual kind of recovery‘, and that investor community should ‘tread and not rush and be guided by the basics’ and first principles when it comes to capital deployment, specifically as the stock and bond correlation will be getting better. Regardless, the macro environment is quite difficult, but we now feel more emboldened as we think about deployment in 2023.
Michael Yaw Appiah (Group Co-CIO)
Important Reflections
Important considerations to our views are summarized as follows:
- Risk & opportunities due to protectionism, global scale export controls and deglobalization. The United States is leading a dangerous global slide towards subsidies, export controls and protectionism. The same but to lesser extent applies to the European Union and other markets. Since 1945 the world economy has run according to a system of rules and norms underwritten led by the U.S. and its allies. This brought unprecedented economic integration that boosted growth, lifted hundreds of millions of people out of poverty and helped the West prevail over Soviet Russia in the cold war. Today the system is in peril. Countries are racing to subsidize industries such as green industry; lure manufacturing away from friend and foe alike and restrict the flow of goods and capital. For instance, the U.S. has virtually made it impossible for companies to sell chips, chip-making equipment, and software containing U.S. tech to China, no matter where they are based in the world. It also banned U.S. citizens and permanent residents from supporting the “development or production” of chips at certain factories in China. Mutual benefit is out and national gain is in. The restrictions are so severe the U.S. may struggle to persuade its allies to adopt equivalent measures. Yet without such unity, they will not work. Other countries with advanced semiconductor industries—in particular the Netherlands and Japan—could undermine their effectiveness by providing China with substitutes. American policymakers will find a worrying precedent in the satellite industry. After America introduced broad export controls against China in 1999, firms in Europe began designing satellites free from American parts to evade the new strictures. American firms lost revenue, but China did not lose access to cutting-edge satellites. After COVID there is massive shift to “localization”, “onshoring”, “nearshoring” and “deglobalization” of productive capacity and sensitive sectors especially in western economies (Exhibit 6A, Exhibit 6B). Our view is the era of zero-sum thinking has begun, that may complicate and fracture various sectors of the global economies. We keep an eye on this due to the opportunities and risks it brings depending on what market and region that aligns to our strategic themes.
- United States capped off a great year for job growth in 2022; moving the unemployment rate down to 3.5%; tied with pre-pandemic levels for the lowest rate since 1969. That is streak of 9 consecutive beats and it is a record since median payroll estimates began collecting in the mid-1990s. Tracking layoffs in 2022; shows technology companies had the highest layoffs followed by health, media and entertainment. The layoff this time involves more and more of educated white collar labor. This is quite unusual and unprecedented because blue collar labor tends to be fired in droves during recessions or economic contraction NOT this down turn.
- Much of the world’s top central banks are at advanced stages of their tightening program. The easing of these program is important one to consider. According to U.S. federal reserve; they are ‘getting close’ to sufficiently restrictive levels. In addition, a greater portion of the top 25 central banks boosting rates will fall to 12% in 2023, compared to fully 84% in 2022. The U.S. dollar hit a 20-year high in value. A number of factors, both domestic and international, contributed to the strength of USD. In 2023, we think USD strength will be maintained albeit much more limited. This certainly a major macro consideration in our outlook. We still insist the top 25 global central banks should resist the temptation to go soft on inflation too quickly. This we think will plunge economies back into U.S. style recessionary depths of the 1970s.
- Inflation in the Eurozone (10.7%) and United States (9.1%) soared to new records in 2022, even though both have reduced. Our data suggest slight drop of Eurozone and U.S. inflation for 2023 although still on elevated levels. Furthermore, systemic factors such as the drastic cooling of the housing market and rising labor costs now better reflects the Fed’s desire to slow down the economy.
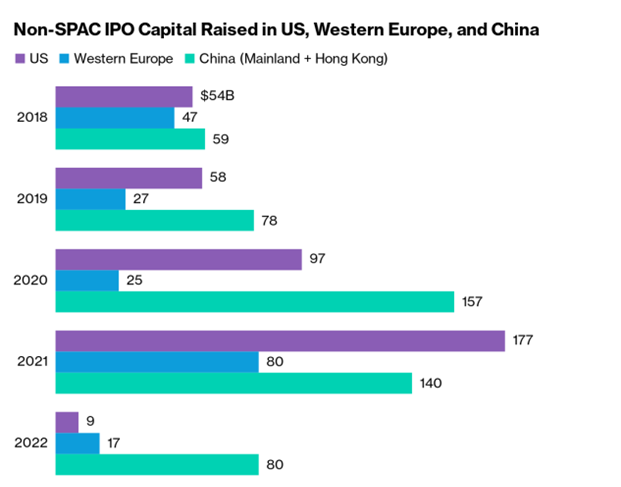
- Capital markets new issuances declined to almost zero. We have been keeping close eye on this. Global IPO market plummeted in 2022; for instance, in the United States IPO’s were at 32-year low. The turbulent economy has made investors more wary of taking risks and certainly less likely to invest. We think 2023 new IPO issuances will be weak.
- Quiet forces at work: Our view is government expenditures will pleasantly amaze on the upside in 2023. Key to this thinking is that key policy programs such as the Inflation Reduction Act (IRA, which contains USD 500 billion new spending) and EU Recovery Plan (EUR 2.018 trillion (inflation adjusted) over 2020-2027) will mean deeper spending than many people will anticipate. At the same time, military budgets are on the rise across the world, as geopolitics is no longer a discretionary line item in most government. Finally, data suggest the possibility of further stimulus in China to offset the headwinds created by recent cooling of housing market; property developer defaults and COVID.
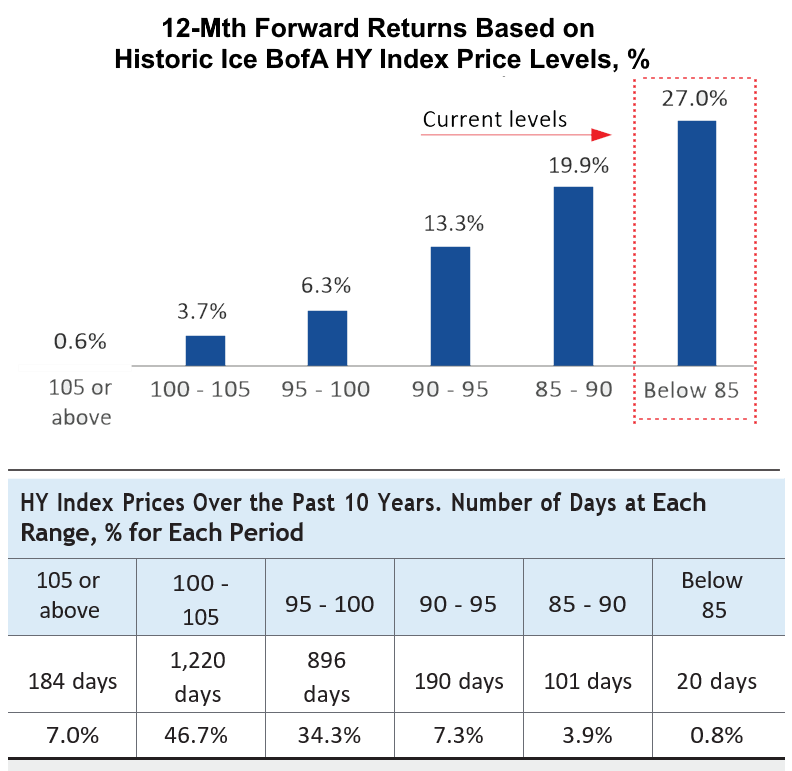
- The “direction of travel” is actually very convincing. In 2021 – 2022 several allocators de-risked their portfolios, especially those that were over-weight the stability of bonds as we transitioned to Quantitative Tightening (QT) from Quantitative Easing (QE). We also take comfort that the S&P 500 has already corrected 25%, an important ‘lean in’ signal based on history, as well as that most High Yield bonds now trade at 85 cents on the dollar, another signal that one should add back some risk to a diversified portfolio. Importantly, our view is that the massive adjustment in the risk-free rate, not necessarily a record widening of credit spreads, will be what is remembered about the opportunity set created during this tightening cycle.
There will be a massive reality check during earning season in January. Our view is investors should go back to basics by using “first principles” in their 2023 deployment budget while cleverly leaning more into the occasional “window” of dislocation in the next 12-18 months. This is not to say 2023 recession will be less severe and that it already priced in the market.
Our going “back to basics” theme, means we are not promoting a full ‘risk-on’ attitude like we did after deep economic contraction during the pandemic. We advocate for asset classes that perform well during recession and stagflation. Foundation to our reasoning is summarized as follows:
- United States earnings forecast are still too high. We worry that earnings will make a “complete U-turn” due drastic fall of unit volume in recent months even as inflation cools. In Europe, earnings are at huge risk in the 1H 2023 especially relative to 2022.
- Major portions of the market still need to correct. Major institutions and individuals are still over-exposed to mega and large cap. technology public equities. This reality is also happening in a regime of high regulatory supervision and increased competition and regulatory oversight. We are 25% underweight Technology in the S&P 500 in the next few of cycles.
- We still see some complicated capital structures, specifically for lending and debts, in depressed parts of the economy that will be tested in sticky inflationary, higher rates, low growth and recessionary environment era. Pessimistic operating leverage, ‘sandwiched’ between “old debt” and new debt, and refinancing risks will all be key subject for discussion in 2023.
- It appears QT is moving at the slowest ever pace (if any). The policy of European and the U.S. central banks both to reduce the size of their massive balance sheets, which now total 65% and 33%, respectively, of their GDPs is moving in an uncertain direction. Our view is execution of this policy will take longer than usual and will massively influence liquidity and financial conditions than in past cycles. In our humble opinion; we will not see the U.S. inflation target back to 2% until 2025/6 cycle at least due to structural changes taking place in economy.
- Last but not the least, we anticipate some unforeseen service delivery across commercial real estate, non-secured consumer lending and commercial non-secured lending in 2023, which could shock some financial institutions and investors in the next few quarters.
Therefore, our key narrative here in a “near” recessionary environment is to “go back to basics” buy assets based on first principles. Stick to high quality, straightforward and uncomplicated assets that are at significant discount; multiplied and diversified across asset classes ― avoid focusing on similar 2010 -2021 portfolio strategy.
Supposing our thesis is correct, then by our first principles; Credit provides durable excess returns than to holding Equities right now across mix of asset classes. You may have noticed considerable number of conventional banks curbing lending; going back to basics means the time is right to be the provider of capital to durable businesses that are aligned to our larger strategies and priorities.
Looking at the public market for e.g., 2022 S&P 500 target fell by 19.5% and we think it will have a negligible rise at current levels in 2023, while senior Direct Lending offers returns in excess of 9%. In a nutshell, we like shorter duration, mid-cap and large-cap firms with attractive call protection profiles. In addition, we prefer assets connected to higher nominal GDP growth.
| Progression of Our Thoughts | “Going Back to Basics” Theme |
| Labor. Looking at the data, our team is persuaded that labor deficit in the United States is systemic in nature due to convergence of demographic trends and COVID- specific behavioral changes. Amazingly, there is something un-usual happening in the labor market. There seems to be greater number of white-color worker professionals’ layoffs relative to the rest of the work force. Further to this shock is there are more blue-color labor shortage. This just incredible. In additions, the surge in retirements since 2020 “accounts for essentially all of the shortfall” in labor force participation rates. More than 50% rise in the number of retirees appears to be a direct result of the COVID. | The new normal in our premise is higher and sticky inflation. We like themes that solve labor shortage issues for e.g., Advanced robotics and automation, Applied AI, Digitalization, Industrialized machine learning, Trust architecture & digital identity, Decentralized internet and family care services, all of which help to address the current labor shortage. We also think it is more important than ever for management teams to be aligned with their staff. |
| The Bond Market “Bloodbath”. The setup for the bond market entering 2022 (low rates, rising inflation, tightening Fed) was a powder keg just waiting to explode. The result: an explosion – it was the worst year for bonds in history. | We expect less duration risk for bonds, a notable change in our thinking about asset allocation |
| The Pace of Rate Hikes Becomes More Relevant. We still see a low-rate hikes at a slower pace than initially anticipated in 2023. With inflation hitting a 40-yr high of 9.1% in June 2022, the Fed embarked on a much more aggressive path than anyone expected. They ended up hiking rates 7x, the biggest annual spike in the Fed Funds Rate since 1980. We expect a peak tightening of financial conditions to occur in 2023/4 cycle. | In the United States, we have lowered our inflation forecast to 4.2% and Eurozone inflation target is 5.1%. At the same time, we expect the dollar to be less of a headwind to financial conditions in 2023. |
| Stocks/Bonds Pressure. 2022 was the worst year for a 60/40 portfolio of the S&P 500 and 10-Year Treasury Bond since 1937, and the first time both assets fell more than 18% in a calendar year. | Reviewing the data, whenever 60/40 portfolio has fallen 18%+; this portfolio picked up and performed well the following 2-years. |
| U.S. House Market Squeeze. A mix of skyrocketing prices and skyrocketing mortgage rates made housing more unfordable than ever before. What followed: a collapse in demand/activity, and then with a lag, prices starting to fall. The median price of home sales in the U.S. fell 10% from its peak in June 2022, the largest decline since 3Q2010 & 1Q2011. After peak of last housing bubble prices fell 33%. The same decline today would only bring prices back to 1Q2020 levels. Housing is one of the most direct ways that central banks have been able to slow growth. We expect the U.S. home price to fall by 7% in both 2023 and 6% in 2024, respectively. | Data shows U.S. household net worth is falling faster this cycle than in any other cycle on recordf. In Oct.2022, 30-year U.S. mortgage cost moved to 7.08; the highest since Apr. 2002 albeit cost has since eased; it is still pretty costly for households. The U.S. jobs market is the last man standing but cracks are emerging (in % of states with rising unemployment). On watch for the unemployment rate to tick higher and when it crosses above its 12-month moving average, it should coincide with the onset of recession. Our view for institutional investors is this is the time to acquire housing assets (preferably with low/zero leverage). |
| Earnings. We have higher conviction in our long-held view that earnings will decline in 2023, and we see a lower-than-normal rebound in EPS in 2024. This backdrop means creaky capital structures will be under pressure, especially those with challenged margin expectations | It is too early to just buy all risk assets across the board. Rather, an allocator should focus on long-term attractive valuations in key areas such as Small-Cap Equities, unlevered Private Credit, Real Estate Debt, and select parts of High Yield and Investment Grade Debt. Defendable margins will be key across all asset classes. |
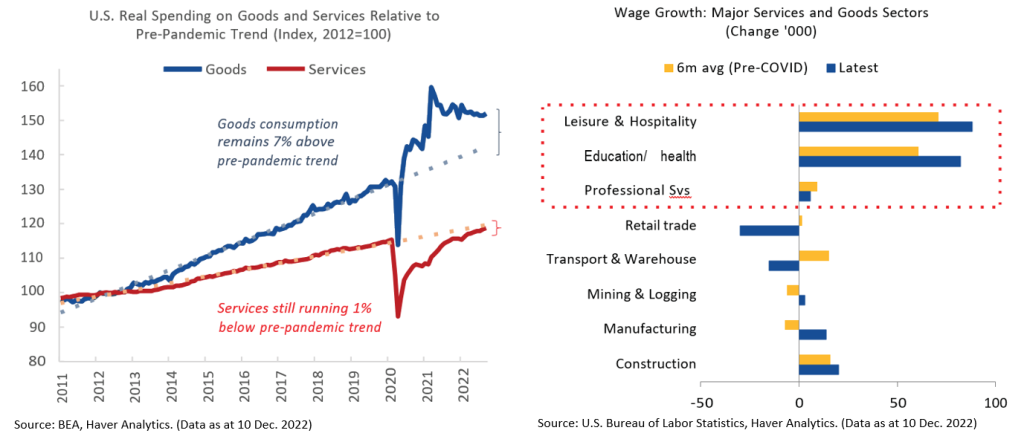
| Services Inflation & Goods Deflation (U.S. / Eurozone economies). Our view is inflation has moved to the services area and will remain sticky for longer. Most importantly, the deflation in core goods picked up pace: for instance, used cars are now in outright deflation | We are overweight towards Services than Goods. We forecast a recession in the Goods sector in 2023, partially offset by an increase in global Services spending. The story in EM is quite different; there is inflation for both goods and services; making economic bad situation even worst. |
| Uncoordinated Global Recovery. Asia’s monetary policies and inflation profiles vary completely than the West. Even with western capitals, there are differences; Europe experienced severe energy supply challenges while the U.S. is food and energy independent. Emerging Markets are facing “shocks” from almost all economic angles. | Reviewing the data, we are underweight emerging markets assets unless they have pure play green energy or energy transition components to it. As such, we prefer selectivity across regions and different markets. For instance, we like corporate carve-outs in Europe, Korea and Japan, and we like higher growth markets such as India and Vietnam. |
| Real Rates. It was near record tightening in 2022 for 25 top central banks. Previously we forecast U.S. real rates will stay between 3% – 3.4% this cycle. By comparison, the Fed brought real rates above three percent at least one time each decade from the 1960s through the early 2000s | Now we forecast Fed funds reaching 5.00% to 5.25% in mid-2023 before settling in at 4.75% to 5.00% by year end. The market is much more bullish on the Fed accelerating rate cuts in late 2023/2024. We are on the side of caution. Meanwhile, in Europe, we forecast the ECB to boost short rates to 3.5% in June 2023 to 3.2% in Dec.2023 through the end of 2024. Our view is longer- term neutral rate closer to 2.75% in Europe. |
| Stagflation. Flattening yield curves, aggressive rates hikes and record sticky inflation in 2022 in the U.S. and Europe meant our initial forecast added the possibility of stagflation risks in the major western economies (in 2023). New data have softened our stagflation call. We are still monitoring the situation critically. | Suppose our call for stagflation for 2023 is right, then we have strong conviction in the following asset classes: U.S. TIPS (10-Year), Select Commodities, Real Estate, Fixed Income Value and Fixed Income Carry. Reviewing the stagflation events and data from 1970-71, 1974-76 & 1980-81 suggest mix of these asset classes performed well. |
The narrative in 2023 will be unlike 2022. The following comes to our attention:
- Noticeable slowdown of GDP growth in 2023. We think U.S. real GDP will fall to 0.4% in 2023 from 2.0% in 2022 and then rebound to 1.9% in 2024. Across the Atlantic, the average Eurozone real GDP is expected to drop significantly from 3.4% in 2022 to 0.6% in 2023 and rebound to 2.1% in 2024. These huge GDP drops certainly suggest both the U.S. and Eurozone economies will be in recession as the economic contraction will intensify and spread more broadly over the next 12 months.
- We think the tempo of central bank tightening are possibly at its zenith. The top 25 systemic important central banks will slow down tightening by 4Q2023 or 1Q2024. We think only 3 or 4 will still be tightening be the of 2023 cycle.
- In the labor front, we forecast positive real wage growth for the U.S. in 2023. The Eurozone projected wage rise for 2023 is 3.3% which is 0.3% higher than 2022. Supposing our calls are correct and unemployment lags versus other cycles, we do not foresee a 2008/09-kind of downturn in the United States and in the Eurozone.
- Our view is the U.S. dollar will no longer be a hiding place or safe house. We have cut the forecast for the USD index and expect present dollar weakness against G8/G10 countries (ex. Japan) to be more pronounced as worries of intensity of economic contraction begins to ease.
- Tightening financial conditions and not just interest rate hikes will severely impact corporate profits and consumer balance sheets. Suppose we are correct, then longer-term rates may peak temporarily as earnings disappoint. In addition, a lot of metrics have not “flowed” through to corporate earnings.
- Massive economic activity in China will pick up due to its re-opening and support measures for the property market. This we believe have the potential to lift Asia from its “flat” growth targets. We forecast growth above consensus in both 2023 and 2024.
Exhibit 6A: World Economic Integration Has Been in Decline Since 2008–10 Global Financial Crisis, Ushering in An Era of “Slowbalization” or Even “Deglobalization”.

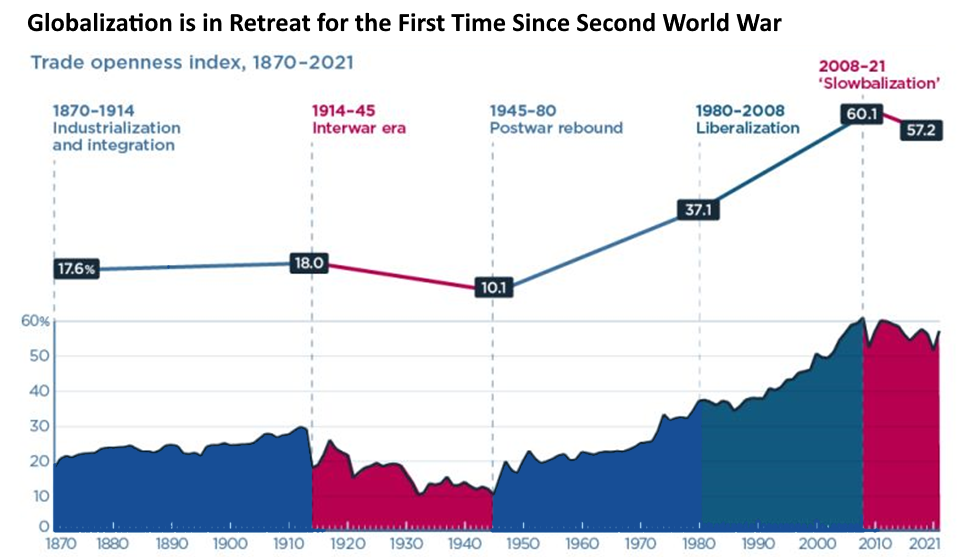
Exhibit 6B: Scrutiny of Foreign Directs Investment at All Time High

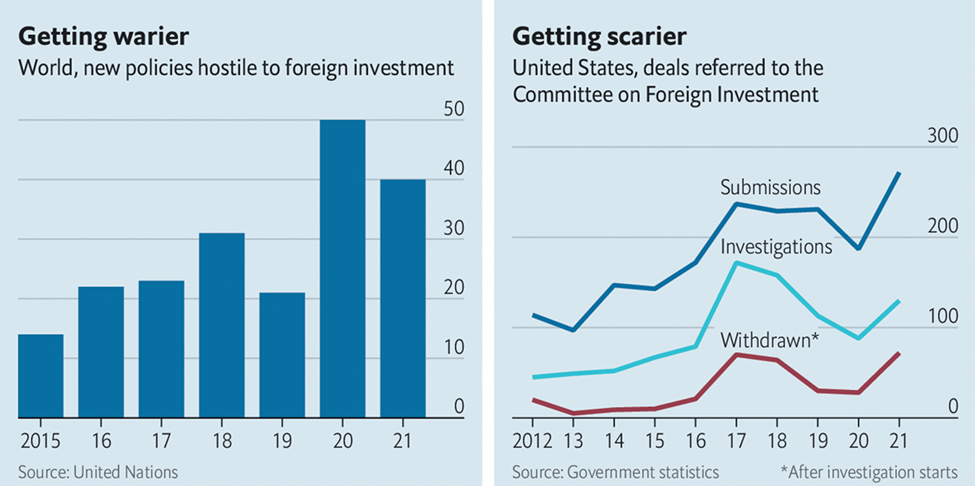
Exhibit 7A: Structural Labor Shortage Due to Pandemic in OECD / G7 /G10 Markets

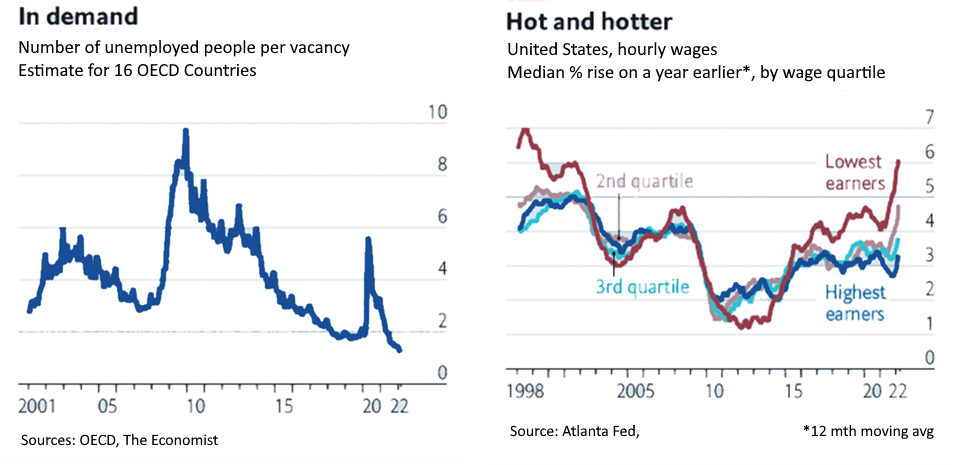
Exhibit 7B: In the 2023 Cycle, Inflation will Certainly Drop Below Wage Growth

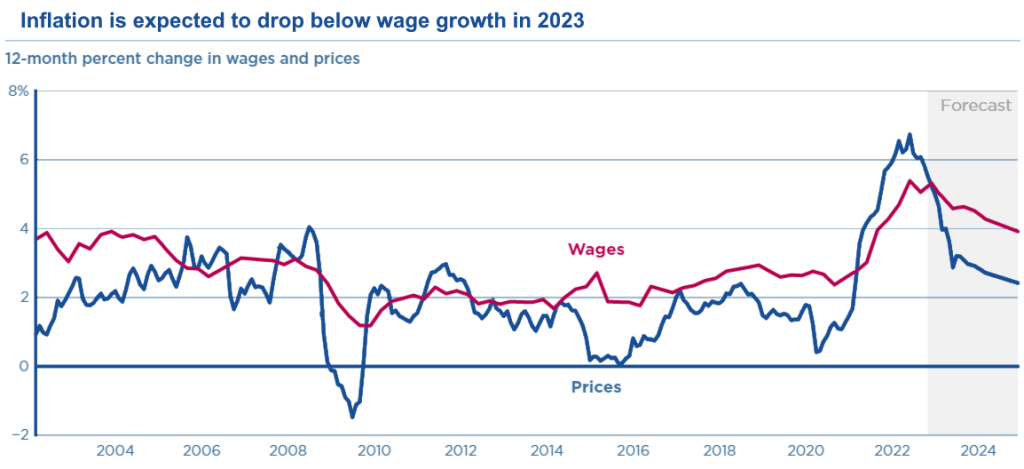
Exhibit 7C: Automation Opportunities in Markets with Persistent Labor Shortages. Automation will Account for 25% of Industrial Companies Capital Spending Over Next 5 Years

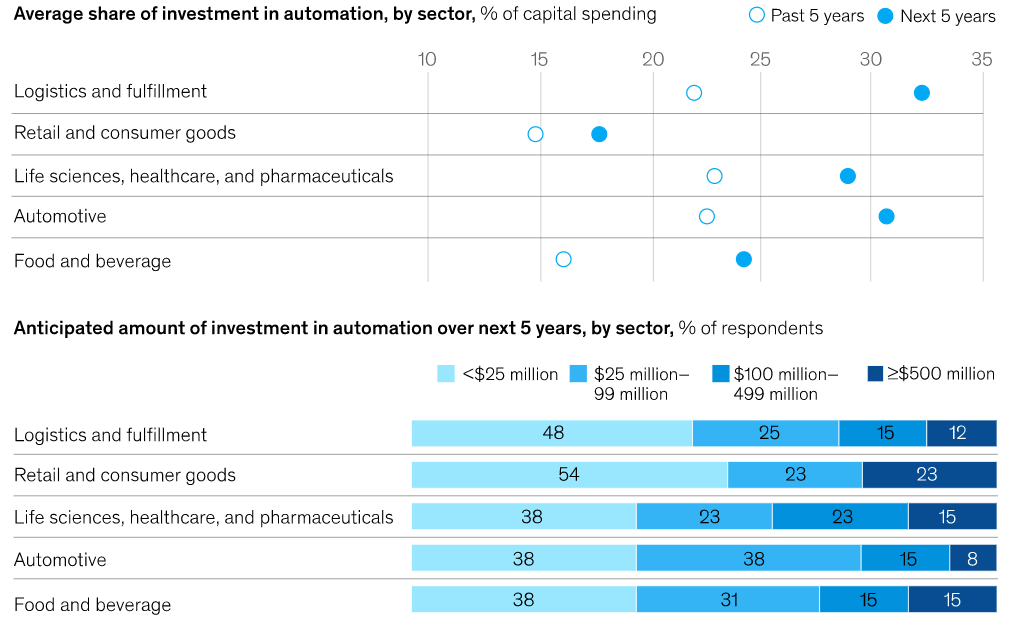
Exhibit 8: I) The USD Strengthened Significantly in 2022. It Reversal will be Good for Risk Assets. II) Historically, Risk Assets in Equity Markets That Crash by More Than 22% Tend to Perform Well

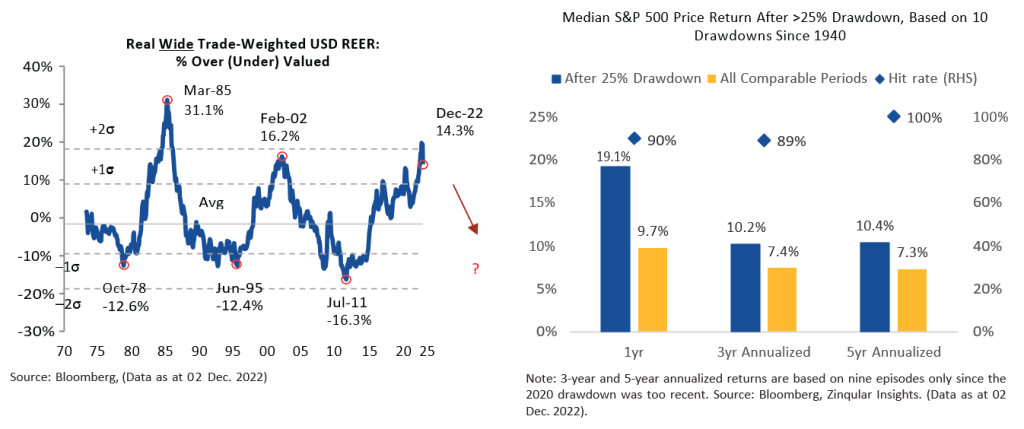
Exhibit 9A: I) 2023 Should Be a Lower Inflation Environment. II) The Value of the Illiquidity Premium Tends to Go Up in Bumpy Markets

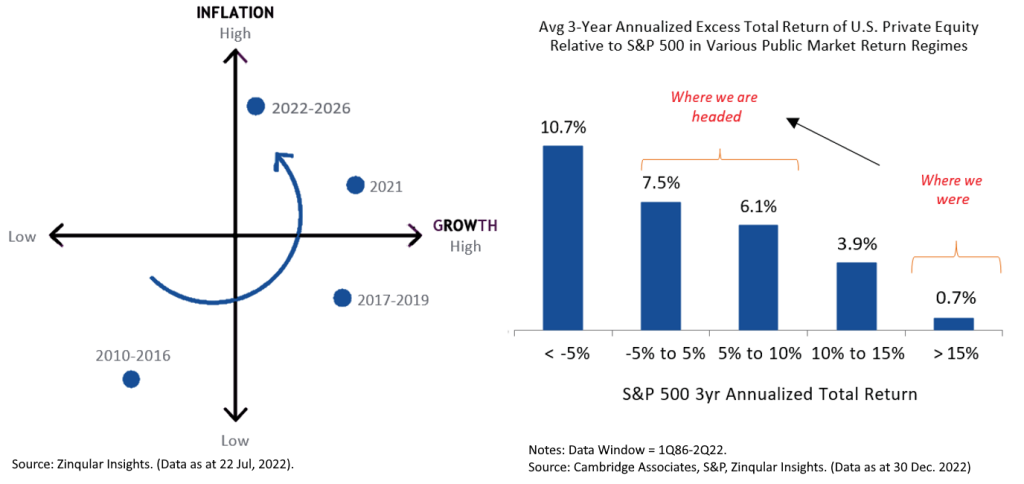
Exhibit 9B: High Yield Bond Prices Indicates Much Stronger Performance Lies Ahead

We are closely monitoring important indicators to identify social and economic triggers that will shape the global economy in 2023.
- It appears the Fed will ease tightening as sticky inflation is slowly being tamed; this among other factors will subsequently weaken the U.S. dollar (Exhibit 8).
- We expect earnings to substantially drop in 2023. Earnings and valuations don’t bottom together. Historically, stock prices bottom 6 to 9 months before earnings (i.e., EPS) reach their low as multiples start to rise reflecting potential Fed cuts and accommodative policy ahead.
- Recession debate: Looking at the bond market, we think there will technical recession in the United States during 2023 (markets tend to bottom about half way through a recession). The bond market’s base case is immaculate disinflation, and let us show you why. Recession for the past 30 years shows that on average the Fed cut by 350 bps over an 18 months period. The current bond market is pricing 200 bps worth of cuts between June 2023 and December 2024, so that must mean the bond market’s base case (60%) is a recession. Our 2023 recession call still remains even after factoring metrics such as – the ultimate landing point for Fed Funds and real yields; the credit market and the tails.
Exhibit 10A: Currently Capital Markets are Attractive for Lenders with Capital via Supply/Demand Factors

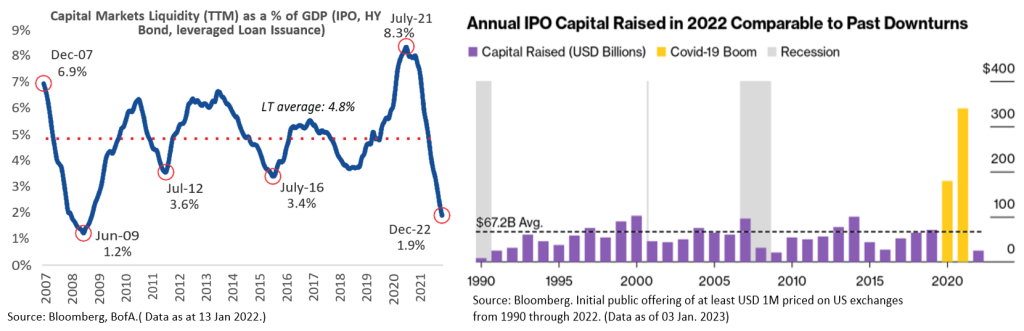
Exhibit 10B: Currently Capital Markets are Attractive for Lenders with Capital due to Supply/Demand Factors

Key Investment Convictions for 2023
In the next few cycles, we bear the following essential themes in mind:
Green Energy, Net-Zero & Energy Transition Remains a Mega-Theme. This theme is as enormous as the discovery and impact of electricity in 1831 or the impact of internet in the turn of the century. It will likely lead to different forked results of spectacular successes and huge failures like the dot-com bubble of internet firms that failed. The recent European COVID recovery plan (i.e., “NextGenerationEU”) and U.S. Inflation Reduction Act will certainly lead to more winners than losers. One useful metric is that while the Internet had a deflationary global impact, we think the green energy or energy transition theme will be an inflationary one. Commodities necessary to maintain growth in onshore wind, offshore wind, batteries, fuel cell, etc., need a lot of energy to extract and process. In addition, many of these commodities are sourced from unstable areas of the world. Close to 64% of the world’s refining capacity of commodities, including nickel (60%), lithium (72%), manganese (98%), and cobalt (71%) is currently processed in China at a time of intense geopolitical risks like U.S.-China tensions. In summary, the energy transition must certainly resolve energy reliability, security and affordability as well as sustainability, this will impact its direction and speed.
Exhibit 11A: Mineral Requirements for Clean Energy Technologies by Scenario, 2021 & 2030. Critical Components Needed for the Energy Transition Will Likely Make This Transition a Bumpy One

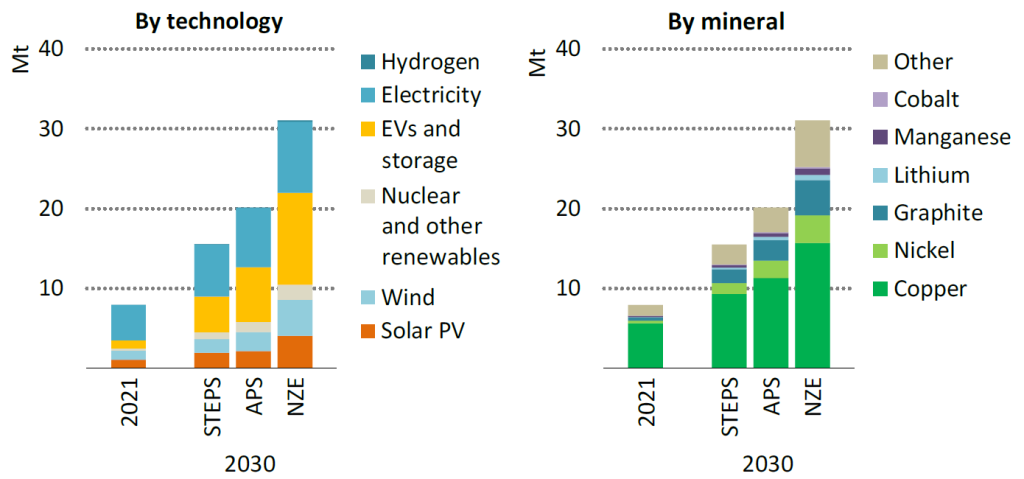
Source: World Energy Outlook. International Energy Agency (IEA). (Data as at 22 April, 2022)
Notes to Exhibit 11A: The Stated Policies Scenario (STEPS) shows the trajectory implied by today’s policy settings. The Announced Pledges Scenario (APS) assumes that all aspirational targets announced by governments are met on time and in full, including their long‐term net zero and energy access goals. Mineral requirements for clean energy technologies quadruple to 2030 in the NZE Scenario, with particularly high growth for materials for electric vehicles. Notes: Notes: Mt = million tonnes; EVs = electric vehicles. Includes most of the minerals used in various clean energy technologies, but does not include steel and aluminium.
Exhibit 11B: Global average critical material requirements for selected energy technologies, 2021.

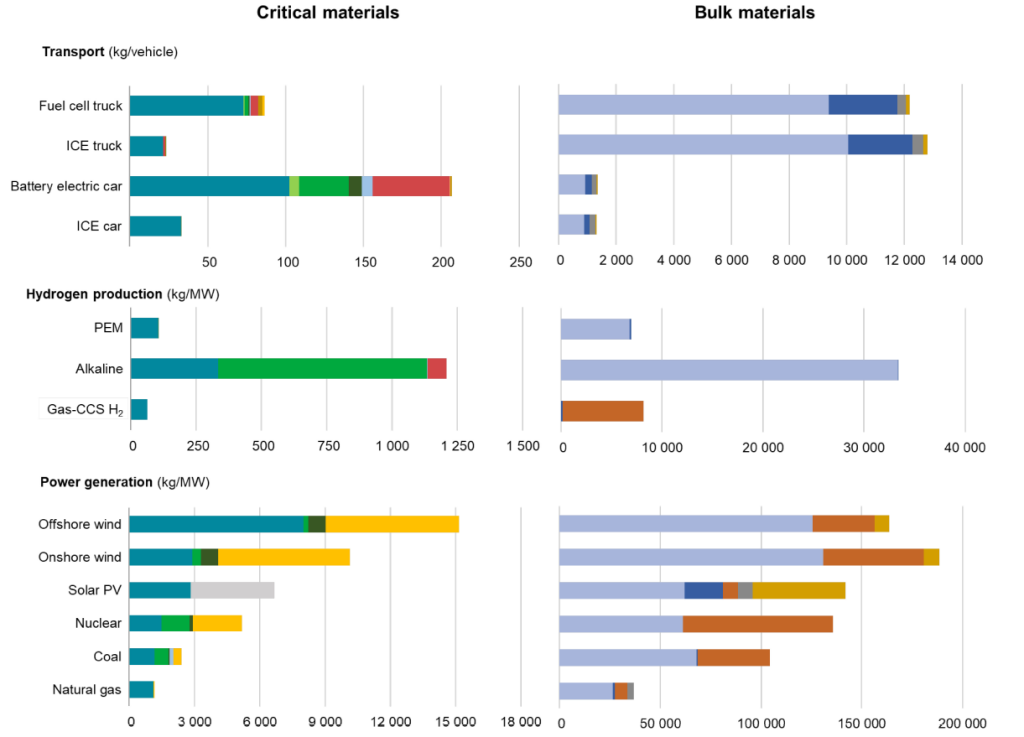

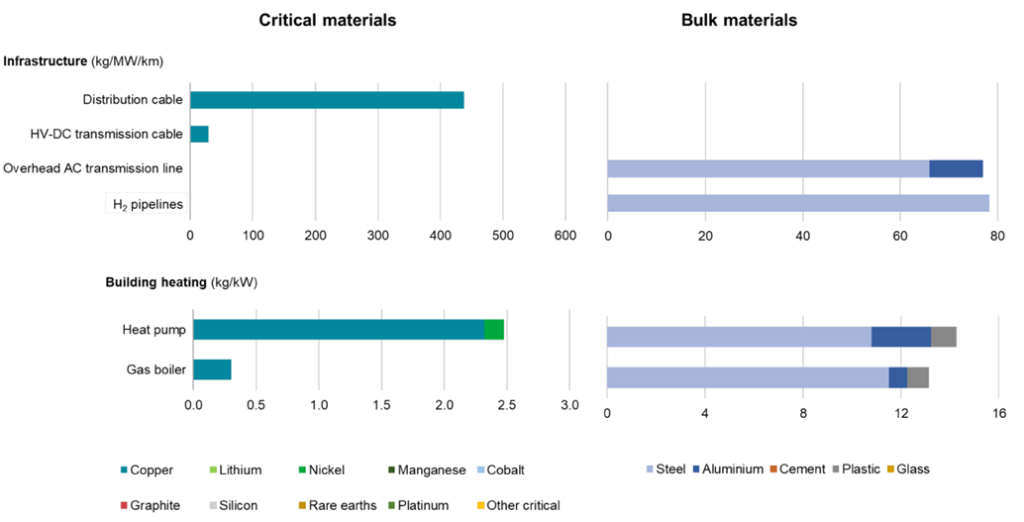
Source: World Energy Outlook 2022. International Energy Agency (IEA). (Data as at 12 Jan, 2023)
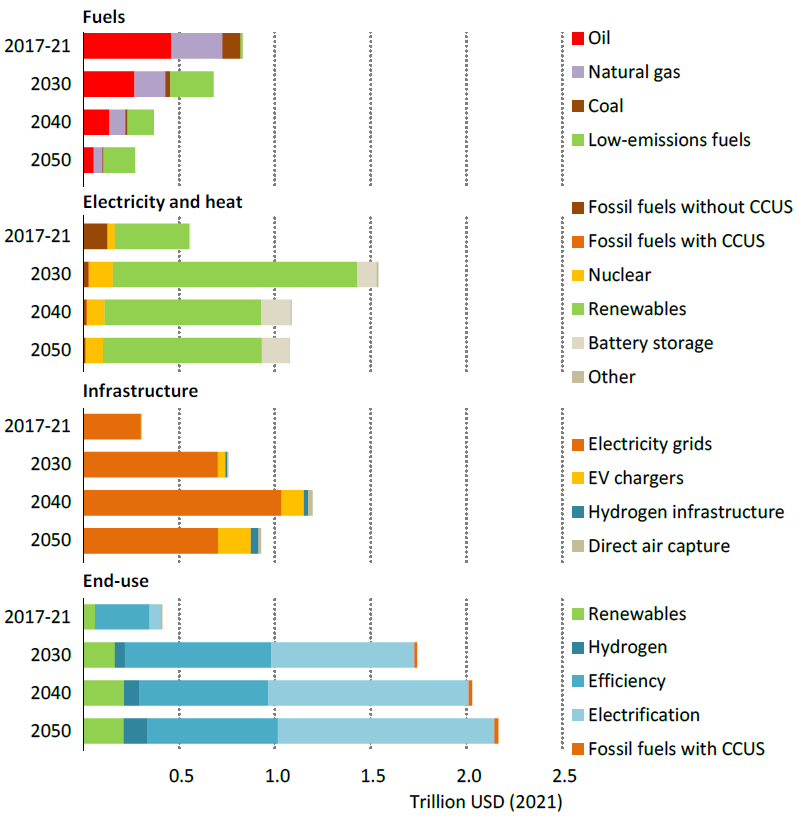
Exhibit 11C: Global Average Annual Energy Investment by Sector and Technology in the Net Zero Energy Scenario will Rise From 2% of Global GDP to About 4% by 2030

Based on our “Going Back to Basics” Theme; We are Overweight to Simplicity at this Point in the Cycle. In a pricey market, we usually like complexity over simplicity to get a better deal and prevent overpaying for assets. In this cycle, however, we favor simplicity. In public Equities, small cap stocks are quite cheap by reasonable metrics, and on a currency adjusted basis Real Estate in the U.S., UK, Eurozone and many sectors in China, Korea & Japan (banks and certain multinationals in particular) are cheap. We think large technology stocks (both private and public) are still pricey. Our view is now is not the time to call the bottom on unprofitable Technology or lend to a uncompetitive or “zombie” company to capture few 100 – 200 basis points of yield. In cross-over funds, we like convertible security offerings that plug a financing hole, especially where there is an incentive to get called away within a few years and/or pay down the debt. In the area of Credit; investors should acquire high quality credits and mortgages where the firm or collateral has attractive cashflows.
In Real Assets, we still favor Asset-Based cashflows or Collateral-Based Cashflows and continue to believe it is an attractive theme. Data suggest many investors are underweight Real Assets in their portfolios; there is high degree of latent demand for this asset class across insurance firms, family offices, and endowments and foundations. In addition, the fundamentals are convincing, especially on the Energy, Asset-Based Finance, Real Estate Credit, and Infrastructure sides of the business. Also, as we detail below, we think that Real Assets, and Energy in particular, could be a really important hedge if the dollar is not as strong in 2023.
Severe Challenges in the Labor Market will Speed up the Shift to Advanced robotics and automation, Applied AI, Digitalization, Industrialized machine learning and Trust architecture & digital identity. Labor cost is at all time high amidst slow moving demographics, a scarcity of well-trained labor force for key industries, a lower participation rate and less immigration; that is why firms will focus increasingly on technology-driven output gains. To this end, we recently saw robots ‘working’ in restaurants. If we are right then labor scarcity will inspire another era of automation discoveries including a greater focus on worker re-training (Exhibit 7C). Another dimension to the current labor cycle is the un-usually large number of white-color layoffs relative to the rest of the work force which represent the excessive bloat in the technology sectors further emphasizing our point technology sector is still not cheap. We think there will be more technology layoffs relative to recent history.
Automation can create more jobs than it replaces. The worries that have surfaced about automation replacing workers or increasing wage inequality are well-intentioned but unfounded. Automation has been shown to create as many jobs as it replaces and wage stagnation and inequality are driven by a variety of factors and cannot be blamed on automation alone. It is important to recognize that automation, along with other innovative technologies, makes manufacturing more attractive to workers. These jobs are family-sustaining and have an upward path via upskilling – in addition to being safer, less repetitive and more inclusive by reducing or eliminating strength requirements for different roles.
Adaptability: The reliability and dependability of all things. The world economic integration has been in decline since 2008–10 global financial crisis, ushering in an era of “slowbalization” or even deglobalization. Reviewing the data; the ratio of world imports and exports to world GDP—reveals 5 distinct eras of globalization since 1870 (Exhibit 6A):
- Advancements in transportation deepened international economic integration prior to the outbreak of World War I.
- The economic dislocation of war and protectionism during the Great Depression led to a reversal of globalization from 1914 to 1945.
- Economic integration rebounded after World War 2 and continued to increase for the latter half of the 20th century.
- An embrace of economic liberalization saw the removal of trade barriers in large Emerging Markets and led to unprecedented levels of international economic cooperation, peaking in 2008 at 60.1%.
- From 2008 economic integration has been in retreat, falling to 57.2% on the openness index in 2021. China & the US have turned toward erecting mutual trade barriers that have disrupted supply chains and prompted the spread of trade barriers elsewhere.
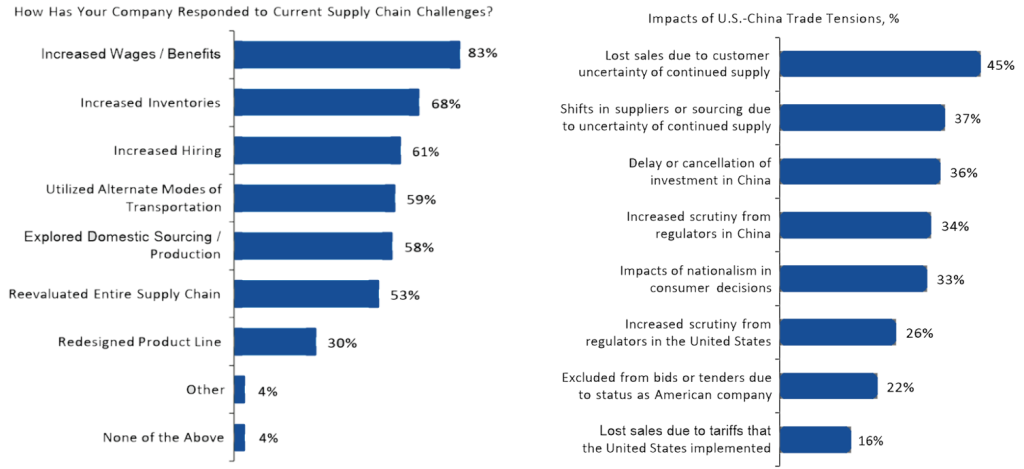
Our view is, the world is at an inflection point over growing fears about globalization and economic interdependence. Even if the shift to “slowbalization” trend abates, reversing the damage that has already been done will likely prove difficult. This shift is a big deal, and it means that countries, firms, and even ordinary people must build out more redundancy across not only energy but also data, food, pharma, technology, water, and transportation. These sectors and their supply chains will be subject to greater geopolitical oversight, in terms of both industrial policies intended to build national providers of these services and also scrutiny of foreign investment and resiliency of supply chains. In addition, we think almost all aspects of defense spending are poised to swell. Therefore our ‘security of everything’ concept represents hundreds of billions of dollars in OPEX and CAPEX that may help to cushion the blow of the global economic slowdown we are experiencing.
Exhibit 12: Senior Leaders of Firms are Actively Exploring Domestic Sourcing & Production in Their Reevaluation of Supply Chain Security. We Think Global Supply Chains Will Become Both More Diversified and More Resilient

Uneven Normalization: Goods during the pandemic had outsized share of the Global consumer’s purse at expense of Services. Post-pandemic it was expected that the consumption will eventually “normalize” with Services eventually gaining more consumer spend. This call has certainly been correct one over the past year, and our view is it will continue to play out in 2023. We continue to support exposures towards Services and the data amplifies it. In the U.S., Goods buying is still at 9% above trend (down from 17% high in 2021) and Services is at 2% below trend (up from 6% below in 2021). This call is valid for almost all markets in the world. For instance, Asian region will experience major Services boost (i.e., tourism, health and beauty services, and entertainment) led by ASEAN region, and Japan.
Exhibit 13: Goods Over Services Theme Which Began in the Pandemic is Back Pedaling to Normal. Labor Gains Are Moving to Services

—
Green Energy, Net-Zero & Energy Transition Remains a Mega-Theme. This theme is as enormous as the discovery and impact of electricity in 1831 or the impact of internet in the turn of the century. It will likely lead to different forked results of spectacular successes and huge failures like the dot-com bubble of internet firms that failed. The recent European COVID recovery plan (i.e., “NextGenerationEU”) and U.S. Inflation Reduction Act will certainly lead to more winners than losers.
Barry Simon Graham – (Group Co-CIO)
Going Back to Basics: Assets We Favor
Consistent to our view, we want to tag what we FAVOR and what we AVOID that reflect our views as to where we believe portfolio managers and asset allocators should be leaning in and out. They are summarized below:
FAVOR > We like Simple Credit; we like to be liquidity providers when others can’t. Spreads are not “out-of-place” as 2008 and lots of negative news has already been priced into it. Simple Credit absolute yields look very attractive in an environment of we lower overall returns for most portfolios in the next 5-10 years. Currently, we favor high quality municipal bonds, mortgages, CLO IG /A-AAA liabilities, senior direct lending, etc..
FAVOR > We like international physical and tangible assets (i.e., hard assets). Several global currencies are cheap; therefore, we believe some strategic asset managers are on the market acquiring overseas hard assets, specifically in the Real Estate and Infrastructure sectors. Asset allocators should move quickly to buy high quality Real Estate assets in key global metropolitan markets such as Beijing, Los Angeles, Chicago, Melbourne, Munich, Stockholm, Frankfurt, Shanghai, Istanbul, Buenos Aires, Barcelona, London, Paris, and Tokyo. Fiber and data infrastructure plays across most parts of the world are attractive themes for Zinqular allocations. Refer to Exhibit 8 for illustration of periods versus opportunities adjusted on dollar basis. We also think hard assets in many parts of both Europe, Asia and South America are very appealing.
FAVOR > In public market, we favor distinct sector selectivity. We like sectors such as Energy, Industrials and Big Pharma over unsecured lending assets within Financials and/or Consumer sectors and Large Cap Technology themes.
FAVOR > Equities with strong fundamentals and attractive Dividends. We like assets with rising earnings and rising solid dividend narratives. The current environment is suitable for these narratives. Based on “going back to basics” theme, neither are we advocating for nor do we favor extremely high dividends yields in this cycle. To a significant degree, we prefer firms with ascending free cash flow that permits them to regularly boost their dividends and earnings per share.
FAVOR > Reviewing the data of U.S. small cap index, Russell 2000 is at an attractive entry point for long-term investors. All told, the Russell 2000’s next 12 months P/E ratio has fallen to 10.8x, its lowest level since 1990 and 30% below its long-term average. On a relative basis, the Russell 2000’s next 12 months P/E is trading at the lowest level versus large-cap stocks since the Tech Bubble. In addition, 1 out of 4 companies in Russel 2000 is a zombie company. With rates “higher for longer” corporate debts will rollover with 300-500% increase in interest expense; that level of rise will make 1 out of 3 companies in Russel 2000 a zombie company. Our advice is to focus on the top quintile firms with outsized returns, strong cashflow and in durable sectors that can withstand economic and inflation shocks.
FAVOR > Our view is ‘Cyclical’ hedges will be attractive as the USD weakens. We favor select Emerging Markets and Commodities, such as EV Metals (Lithium, Copper, Nickel, Cobalt, etc.) and Energy (LNG and other low carbon Gas substitutes). Data suggest most investors, no matter their region in the world, are overweight USD-based assets. In recent years, this call has been correct. Current macro analysis compels us to favor mix of assets – some quality but “beaten down” EM with very strong cashflow and long-term fundamentals (e.g., Vietnam, Thailand, and Indonesia).
FAVOR > Our view is “Non-correlated” assets are preferred to traditional long/short hedge funds. It is quite shocking that in this current environment, many asset managers are still overweight long/short equity funds in their hedge fund portfolios. We think investors should increase exposure to hedge fund managers (with good liquidity) that can offer attractive non-correlated returns to equity markets. We also think that allocators should align with managers that ‘stay in their lanes’ in terms of liquidity thereby disposing illiquid hedge fund portfolios in liquid books.
FAVOR > We are attracted to Private Vintages. Data suggest illiquidity premium swings up during economic downturns and/or rough market cycles. Predicated on the “going back to basics” theme, linear deployment is key to portfolio construction in the private markets. The narrative in this cycle is to incline both Private Credit and Private Equity.
AVOID | It is about time to sell USD. Why? Our view is the USD is over-owned, over-bought and will eventually weaken this cycle. Previously it has been a good call to own USD assets refer to Exhibits 2, 99, and 100 for details. Reviewing the data, we think trade has begun to turn. We prefer the Japanese Yen (JPY), Pounds Sterling (GBP), Nordic Currencies (DKK, NOK, SEK) a long against the dollar as well as some higher yielding, higher quality Emerging Markets currencies. Tactically, we also think the EUR may have bottomed.
AVOID | We are underweight large cap technology. This asset class is seriously being challenged specifically in the area of valuation and fundamentals. Data suggest for some time now, social media and digital advertising are moving from bad to worst and competition is on the rise. Once a sector peaks over 20% of index, they often underperform over the 3 to 5 cycles. Next, on global scale, greater government regulation of Big Tech is on the rise led by the European Union while global rivalries are up.
AVOID | Portions of Commercial Real Estate will face incremental stress in 2023. The traditional Office sector could face severe stress in 2023, specifically in aged/old properties that a) have terrible environmental standards; b) required to roll debt at higher rates; and c) are connected to sectors that face massive layoff and/or significant work from home trends (specifically in Big Tech sector). Data suggest possibility of rise in bank forecloses on office buildings/properties at reduced prices, which could revalue the entire commodity office building marketplace. That’s goes without saying; we believe there are huge opportunities in Office Real Estate. Our view is the ’old‘ playbook will not produce the good outcomes as in the past. To wrap up, we think there is a significant opportunity in acquiring high quality new assets at attractive discounts to replacement costs in high growth metropolitan markets, specifically in market players divest assets to deleverage other parts of their portfolios; pretty much in line to our “going back to basics” theme.
AVOID | Distinct parts of the financial services sector, specifically Banking connected to floating rate mortgages. We perceive faster than expected worsening of loan loss provisions. Real estate or home prices will likely fall further in 2023; at the same time, increased mortgage rates will mean higher payments in an era of slower nominal GDP growth. If we are right, then Japanese banks will do very well should global GDP not slow down while inflation does ease. Our view is some portions of commercial real estate space will likely create severe anxiety as debt for large scale office complexes matures in the next two years (i.e., 2023 – 24).
AVOID | Sell interest rate volatility specifically at the front end of the curve. Why? Our view is volatility in interest rate is overblown; because we think the Feds funds futures market won’t experience wild swings of 400+ basis point shocks in 2023 as in 2022. In addition, bond yields and term premia are now much closer to our forecast. Therefore, hedging against higher interest rates require a more delicate tradeoff, and so we think securities with built-in call risk such as MBS will be more attractive.
AVOID | There is slow but massive wallet spend shift from Goods to Services. Its on record that the economy will contract and consumers will shift their focus towards experiences over things. We think the Goods sector, including the distributors of retail products, could face significant headwinds. There will be massive reduction of consumer purchasing power in 2023 which we would lead to private label taking aggressive market share from branded products.
–
Key Risks Outlook
In this essay we will narrow our focus on four major risks we think could play out in this cycle:
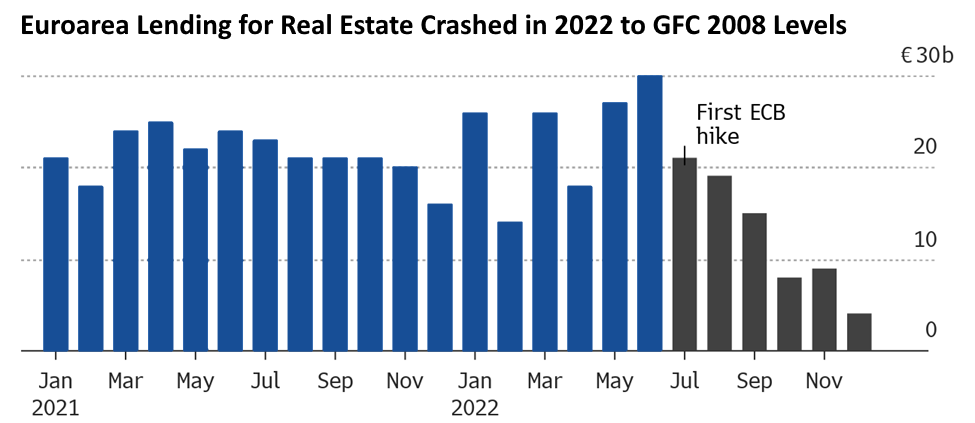
Risk #1: Possibility of Sharp Growth Slowdown Mirroring 2008 Downturn. Reviewing the data, we think growth will slow down but economy will not severely contract like in 2008. 1) Eurozone is facing a rapid contraction of mortgage lending as a jump in interest rates cause financing costs to surge, all but wiping out demand. Loans for house purchases fell below EUR 5 billion in Dec, a 70% decline YoY. The housing market rout continuous is even amplified in Non-Euro area countries. For instance, drop for home prices in the Nordics (i.e., Denmark, Finland, Norway, Sweden) go on unabated with Sweden facing the 17% steep drop in 2022. We think 2023 could offer very little relief for an already troubled housing market. Another real estate markets that was seen as “rock-solid”, Australia and Canada for example, have at last began to devalue, with Canada priced down by a shocking 14% last year. More expensive markets primarily on adjustable rates will certainly follow. 2) We think the Fed will keep tightening policy until unemployment rate moves up anyway. If we are right then this will be a deliberate and controlled growth slowdown. Our forecast is unemployment rise by 1.5% point trough to current peak, similar to 1.9% rise in 2001 compared to 2008 when unemployment surged 5.1%. 3) It will not be required for banks to de-leverage as much as they did during the 2008 GFC. Current leverage scales are 10-13x, not 2008 scale of 20-35x. Consequently, the underlying equity in mortgages are high quality due to better underwriting, tighter supply, and more equity portions in each deal. Our view is 6% fall in home prices in 2023, down from 14% highs in 2022, but we don’t envisage major collapse in G7 economies such as France, Germany and the U.S. (Exhibit 14).
| Exhibit 14A: While Mortgage Rates Have Increased, the Fixed Rate Component Should Help U.S. Consumers Weather the Storm Better Than Some of Their Global Peers | Exhibit 14B: Certainly Not Our Base Case, However Our Attention is On Global Central Banks Tightening Policies to Flag Signs of Tightening Back Into a Low Growth, Low Inflation, Recessionary Territory. |

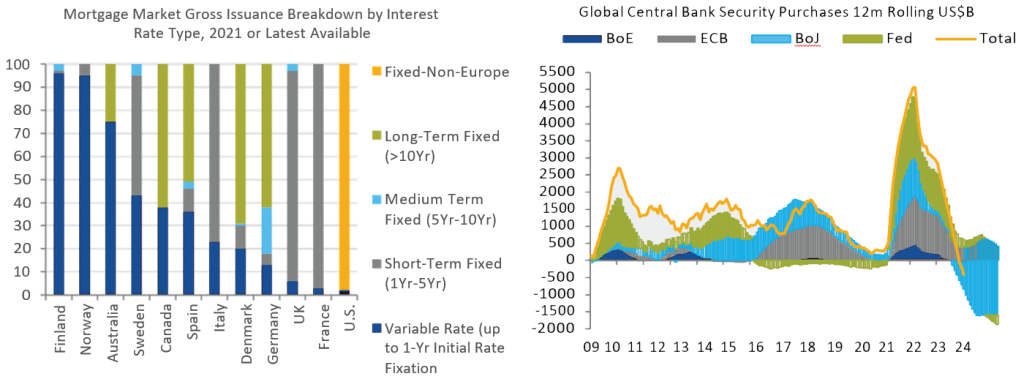
| Source: European Mortgage Federation, FHFA, Australian Bureau of Statistics, Bank of Canada, Deutsche Bank estimates. (Data as at 12 Mar. 2022) | Source: Citigroup, Federal Reserve, ECB, Bank of Japan, Bank of England, and Haver Analytics(Data as at 23 Nov. 2022) |
Exhibit 14C: Forecast That The U.S. Is Past The Peak The Worst Of The Drag From The Housing Downturn. But Still Sees Negative Wealth Effects Will Lead Housing, On Net, To Subtract From U.S. Economic Output

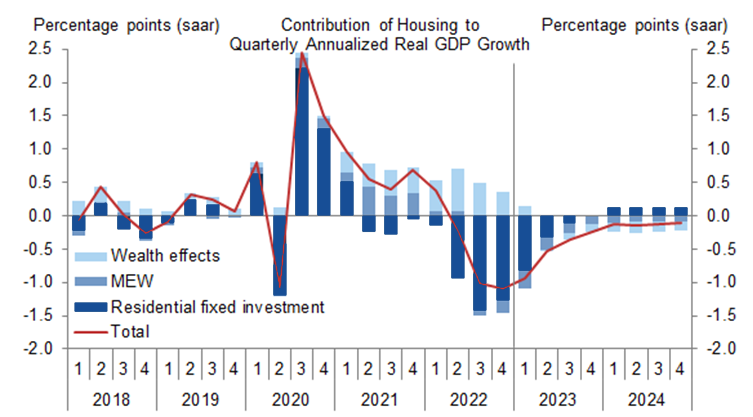
Exhibit 14D: We Think Eurozone Housing Market Pain Will Continue in 2023.

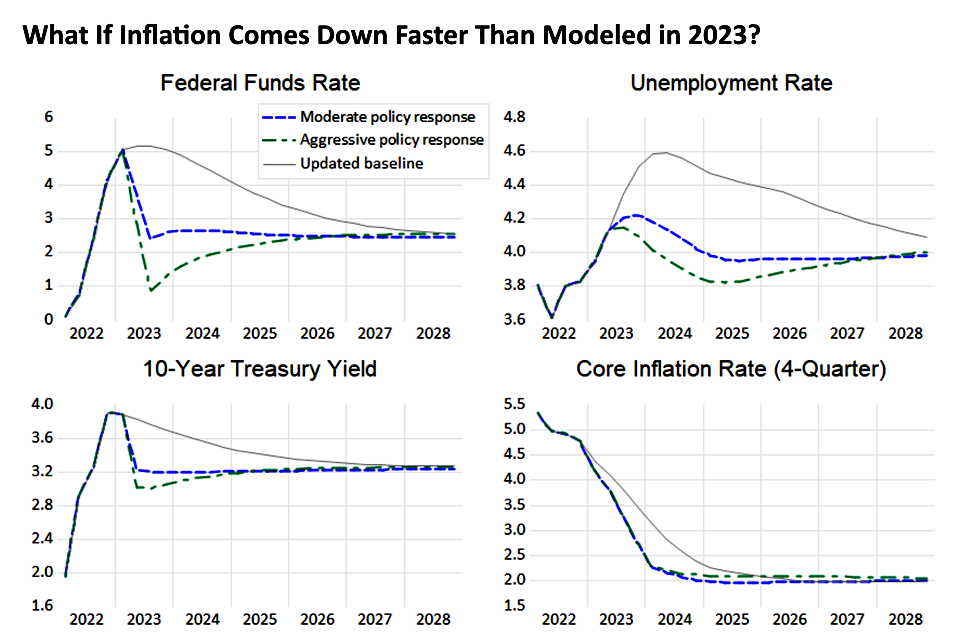
Risk #2: What if inflation falls quickly to pre-pandemic levels than the Fed and the market currently anticipates? The economy will return to secular disinflation era of 2010 – 2020 (i.e., we go back to the lower left quadrant in Exhibit 15). The Fed would likely cut interest rates sooner than in their most-recent economic projections. Lower rates would mean that unemployment wouldn’t rise as much. But monetary policy affects the economy with a lag, so a key question is how effective policy could be at limiting the rise in the unemployment rate once the good news arrives.
Now, other macro investors call as well as their asset allocation positioning will “unbelievably” be “out of synch”. The ‘right’ playbook is return to what worked in 2010-2016 (average inflation at that time was only 1.6%). The portfolio construction those periods included high growth assets, low cash flowing equities with big total addressable markets (TAMs), and/or own super long duration fixed income.
In our humble view, there is only 5% possibility the disinflation scenario will happen due to intense resolve of ECB & Fed to continue quantitative tightening (albeit slow) over the next few cycles. We must remember it was sharp rise in excess liquidity in financial markets that led to sticky inflation. In our view, to have long term control over inflation, the Fed should be running Quantitative Tightening (QT) at a yearly pace of > USD 1 trillion for between 3 to 6 years. We believe the Fed (and it global peers) will steadfastly continue to reduce excess liquidity in the financial market to reasonable levels. 2) We see US wages being stickier this cycle amidst “unbelievable” strong demand for blue color workers between 25 to 52-year-olds workers.
Exhibit 15: Though Not Our Base Case, What If inflation Comes Down Quickly Than Anticipated Suggests Quick Rate Cuts, Lower Rates Means Unemployment Wouldn’t Rise as Much

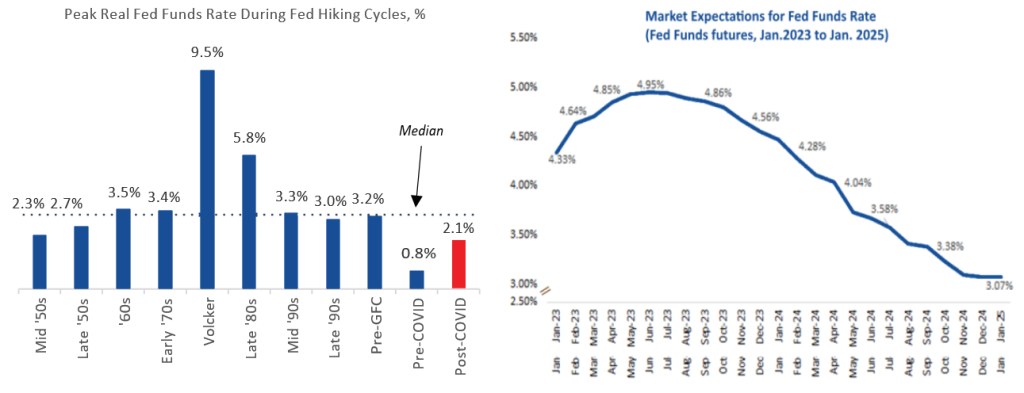
Risk #3: Possibility the Fed Might Significantly Do Much More Than Tame Inflation. Reviewing the data, we think Fed funds rate (FFR) will peak between 4.75% to 5.5% in 2023 and just fall between 4% to 4.86% in 2024 (real FFR or CPI y/y FFR at 1.5% to 2%) (Exhibit 16). There is a possibility that the Fed might tighten much more significantly than anticipated in order to tame inflation in 2023, specifically given consistent strong wage growth and consumer inflation expectations that remain elevated. Supposing we are not correct about how high rates need to go this cycle to tame strong wage growth (i.e., if FFR rise above 5.5%), it will certainly dampen prospects and outlook for all risk assets. But there is only 20% possibility of this occurring; even then, we have several ways to hedge these deliberations in a cost-efficient manner, including but not limited to fed funds futures.
In addition, on a 2023 macro level; the fat tails distributions are squeezing, not broadening. Therefore, the possibility of a 2008-GFC kind event, really high inflation or very low inflation, is waning, not rising. Therefore, the narrative here in 2023 is to carefully tilt into risk using a disciplined deployment plan, quality portfolio construction, and adequate diversification across asset classes and markets.
Exhibit 16: 2023/4 Market Expectations for Path of Fed Funds rate. Rate Cuts Start in Nov. 2023 to 2024 Cycle with FFR moving Under 3%. If the Fed Returns to a More Hawkish Approach, the Tightening Cycle Will Be Much Harsher Than We Are Currently Forecasting.

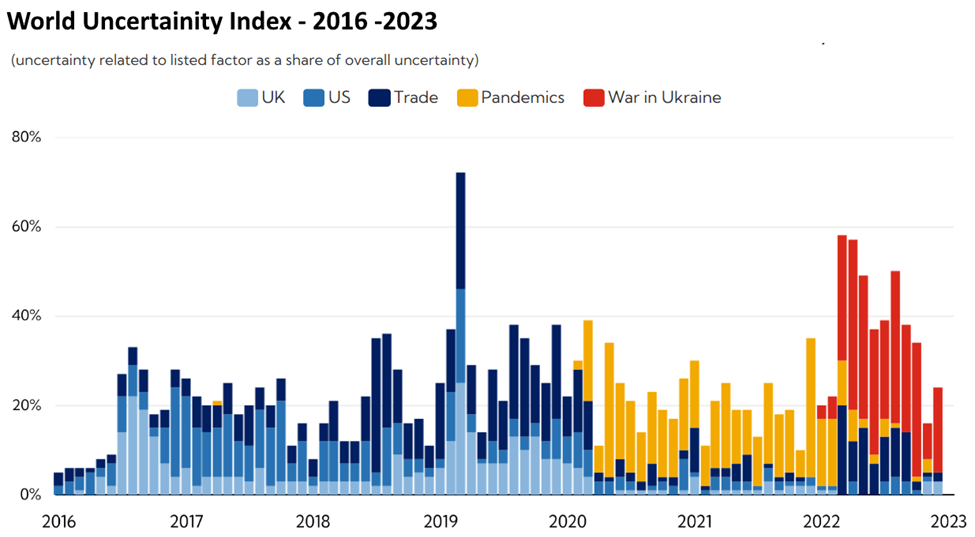
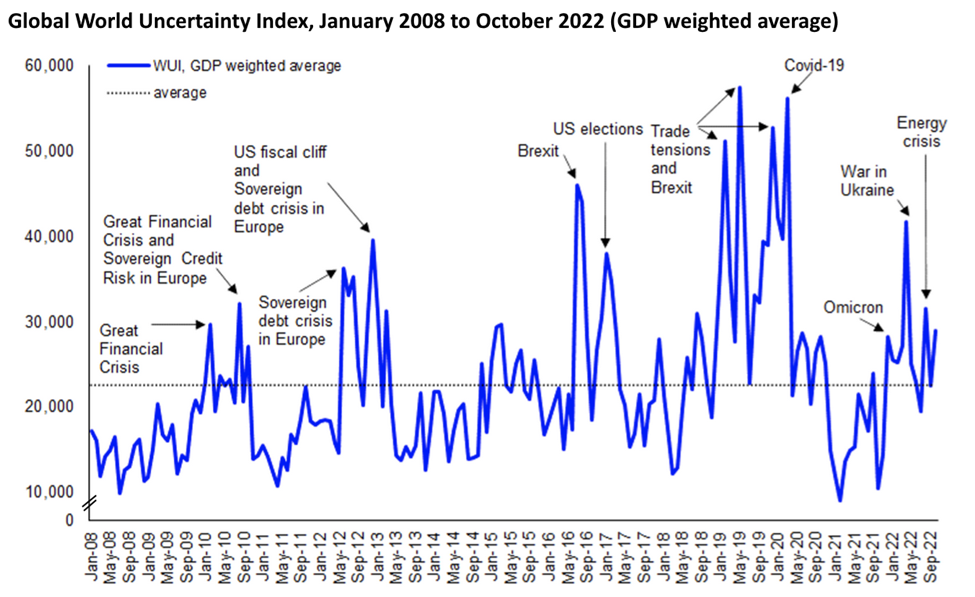
Risk #4: Unbelievable Rise in Geopolitical Tensions Across the World. This time it is different; the tensions are deeper and across board; it appears like the visible hand of geopolitics swiftly subduing the unseen hand that defined economic globalization that brought prosperity to millions of people across the globe.Confluence of shocks that rocked the global economy in recent years have introduced a new normal for turbulence; driven in part by sharp rise in geopolitical tensions, shocking sticky inflation, the pandemic, Russia’s invasion of Ukraine and the rapid tightening of monetary policy by central banks have made bad situation worst in many parts of the world.
For several decades countries sustained their legitimacy and support by achieving strong economic growth via free movement of cheap money, energy, labor and goods. The era of geopolitical tensions means all of these inputs are more expensive – at a time when populism is high, institutional legitimacy is mixed and trust in government is at an all-time low.
The world is on the verge of opening Pandora’s box, if the European Union follows through on threats to mimic America’s protectionist industrial policies, we think Japan, Korea, China, and most of the G20 and/or OECD countries will engage in this very difficult race to ignore global trading rules. The international system of trade and investment, painstakingly negotiated over decades, will be upended. This protectionist policies are affecting industries such as chipmaking, quantum computing, artificial intelligence, biotechnology and clean energy.
Investment screening is up; selling to the highest bidder is not as straightforward as it used to be, especially if that bidder is Chinese or Russian, which means foreign direct investments (FDI)fell from a peak of 5.3% of global GDP in 2007 to 2.3% in 2021. The deals that continue to go ahead are more heavily regulated. In 2022 a Chinese buyer was permitted to acquire only 25% of a port in Hamburg, rather than the planned 35%. In 2021 half of all approvals of cross-border investment in France came with conditions attached. Meanwhile, subsidies programs are altering capital spending. In the semiconductor industry, famed for its boom-and-bust cycles, the risk of oversupply is substantial.
Multinationals having second thoughts about manufacturing in China are in some cases being paid to relocate. Japan included incentives for such relocations in its budget in 2020. India is trying to lure footloose firms in 14 different industries by offering up to USD 26bn of production-linked incentives over five years. Such overtures may become common if commerce begins to fragment and firms are required to choose a side.
Our view is, there are real opportunities to invest as nations build domestic energy, semiconductor, and other supply chains. To this end, we remain quite bullish on our onshoring, deglobalization, resiliency and supply chain security theory. On the other hand, investors will need a sharper domestic political and geopolitical lens for all investments in this new era of great power competition.
Exhibit 17: Global Economic Uncertainty Remains Elevated, Weighing in Growth.


Next Week Check Out Part B of – Going Back to Basics: Global Investment & Economic Outlook 2023