

Authors: Barry Simon Graham (Co-CIO) and Michael Yaw Appiah (Co-CIO)
[wpfd_single_file id=”1979″ catid=”327″ name=”Global Investment & Economic Outlook 2022″]
As we show in Exhibit 29, we generally lag the consensus in terms of growth forecasts, except for in the United States. However, because of our more reflationary bias, we are more constructive on nominal GDP in almost all regions of the world. Just consider, for instance, that – after growing 10.2% in 2021 – we expect nominal GDP growth could reach nearly nine percent again in 2022. By comparison, as the recovery started after the Global Financial Crisis, nominal GDP averaged just 7.1% during the 2011-2016 period.
Exhibit 29:
In The U.S. Our Global Forecasts Are Out Of Consensus While In China, We Are Modest On 2022 Growth Due To Declining Of Real Estate Investments

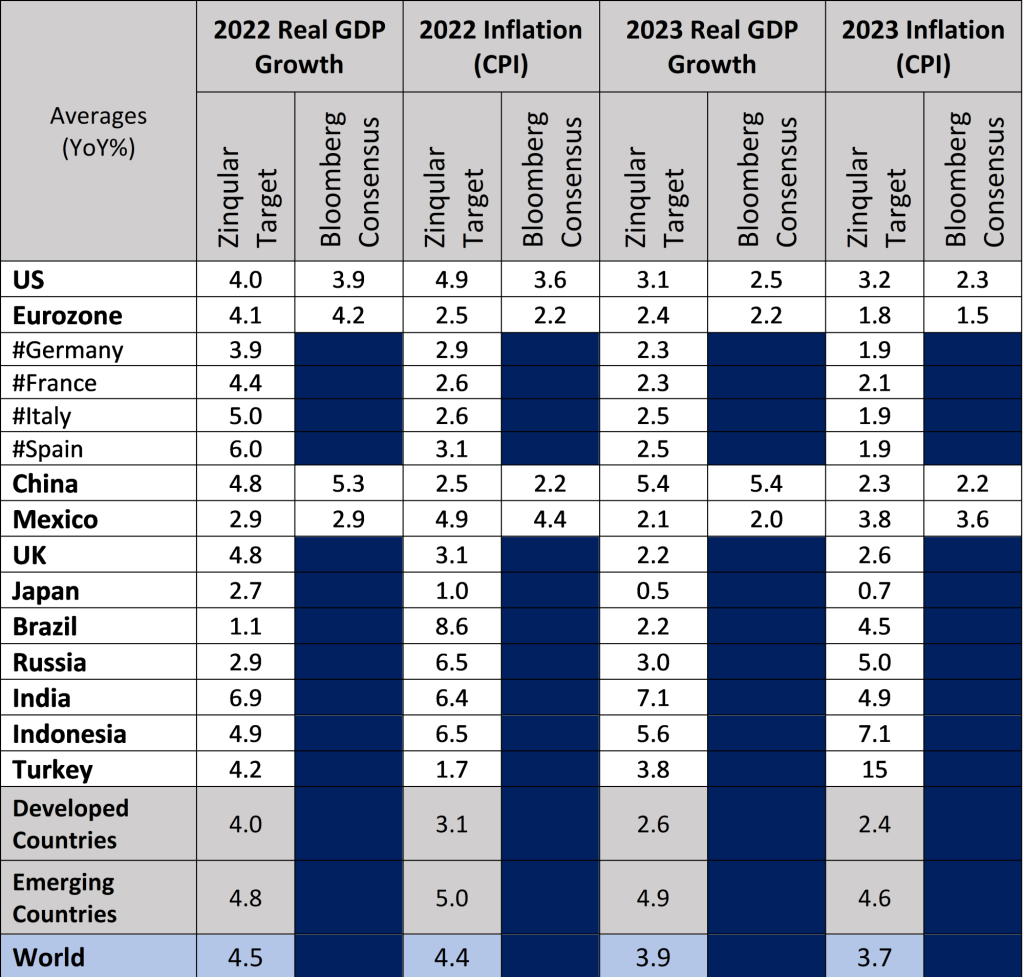
Data as at December, 2021. Source: Zinqular Insights & Research Hub analysis.
Regional GDP in Focus
United States Outlook
This year (2022), we are forecasting U.S. Real GDP growth of 4.0%, 10 basis points above current consensus. For 2023, our forecast, is 3.1% and 60 basis points above the consensus of 2.5%. Our forecast is a view that, while Omicron will certainly impede the recovery in early 2022 (i.e., similar narrative to how Delta “forced” GDP to slow down to 2.1% annualized in 3Q21 from 6.7% in 2Q21), it will adversely affect an already constrained sectors (e.g., leisure, and travel). Therefore, there will not be a considerable new wave of lockdowns creating far-reaching job cuts.
We forecast at least four key enablers that will lead the next leg of the U.S. economic expansion. Particularly, we think business capex, services consumption, private inventories, and exports are all still in the early phases of economic restart. There will certainly be tailwinds from these factors to offset headwinds from consumption of goods and services. Generally, our U.S. GDP indicator supports these calls, as we expect growth remaining above-trend through mid-2023, but with some considerable deceleration as high energy prices and labor force constraints hinder growth around 3Q2022-2Q2023.
Exhibit 30:
Manufactured Goods Inventories Is Still Historically Low. Expect Sizable Scope For Recovery

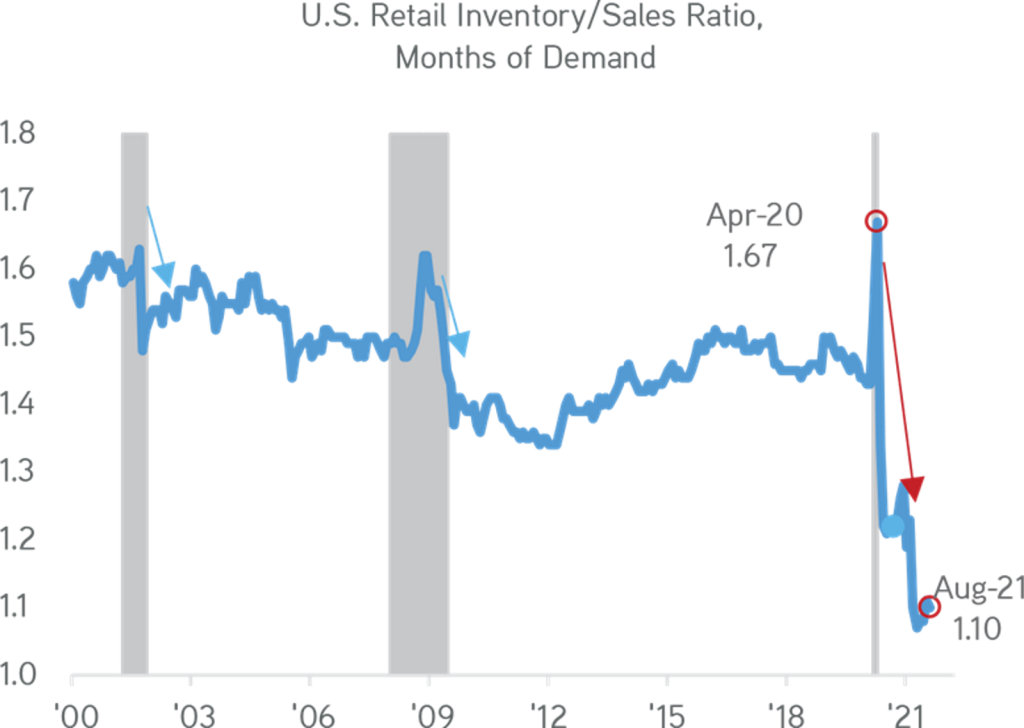
Data as at December, 2021. Source: Bureau of Economics Analysis, Census Bureau, Zinqular Insights & Research Hub analysis.
Exhibit 31:
Early Stages Of Lift-Off Of Cyclical Low From Capex

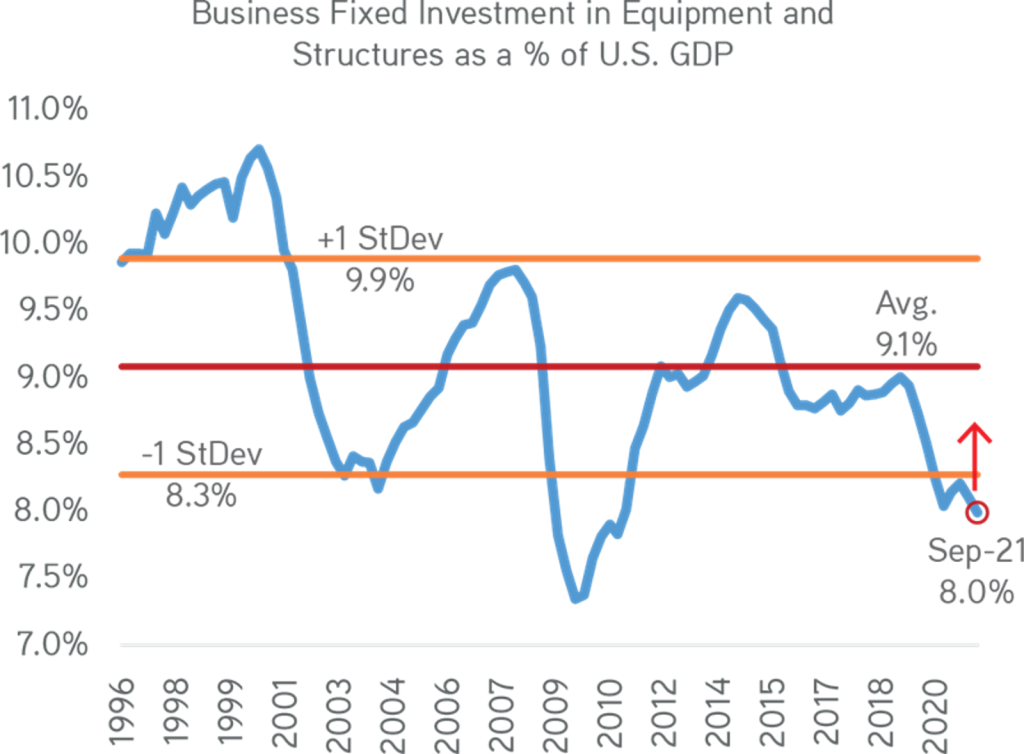
Data as at November 24, 2021. Source: Bureau of Economic Analysis, Census Bureau, Zinqular Insights & Research Hub analysis.
Exhibit 32:
Despite Higher Oil Prices, Consumption Will Still Strong In 2022

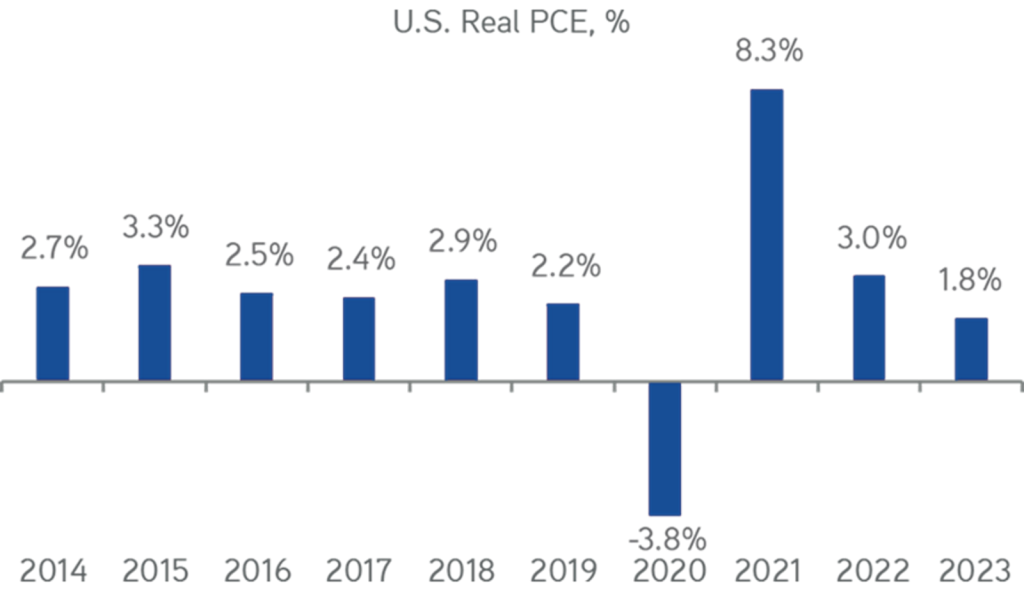
Data as at December 6, 2021. Source: Bureau of Economic Analysis, Census Bureau, Zinqular Insights & Research Hub analysis.
Exhibit 33:
We See Net Exports Lift-Off Into Positive Direction. Foreign Tourism Will Further Bolster These Trends

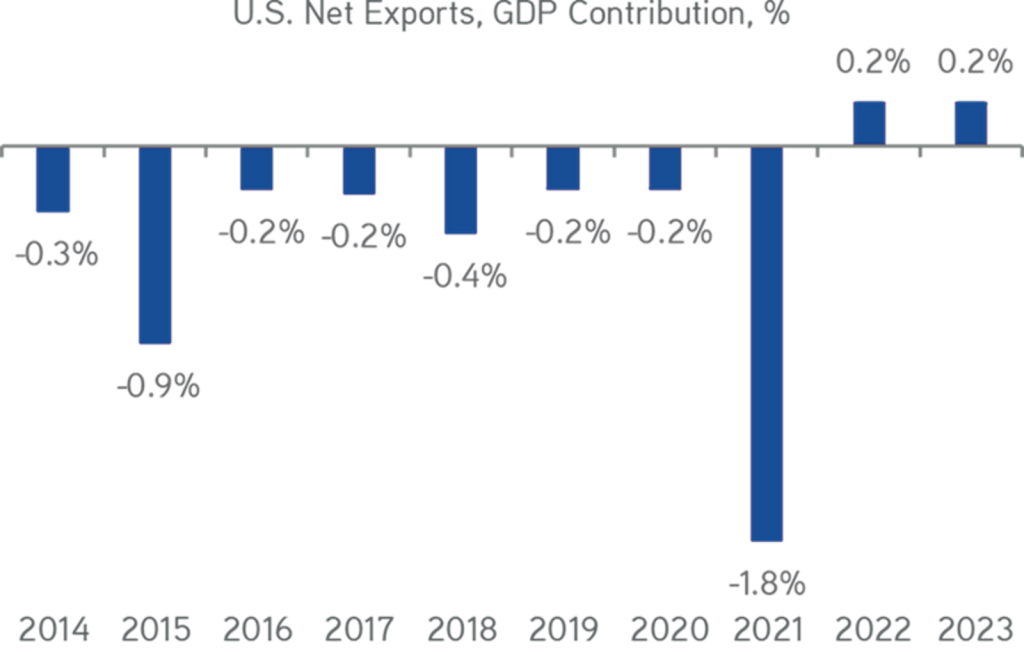
Data as at December 6, 2021. Source: Bureau of Economic Analysis, Census Bureau, Zinqular Insights & Research Hub analysis.
Inflation pressures from goods and services inflation will move upwards in the near term, reaching its highest by 2H2022. Therefore, the main CPI will be 4.9% to 5.0% in 2022, above the consensus of 3.6%. Digging further into this change, we would flag several ‘interesting’ inflation factors including: a) Housing inflation, that will enable about 40% of core CPI, is likely headed considerably higher in coming months; b) Automobile price inflation continues from bad to worst due the semiconductors chip shortage; c) Broadening inflation pressures as 24 of the 26 sub-components of CPI are now above the Fed’s two percent threshold; and d) Record number of workers are quitting their jobs—primarily for new ones with higher pay (the pace of quitting is normally be associated with unemployment of approx.. 2%).
Exhibit 34:
Inflation Will Run Over 7% In 1Q2022. Services Inflation Raise Up As Goods Are Still Supply-Constrained & Prices For Commodities Are Elevated

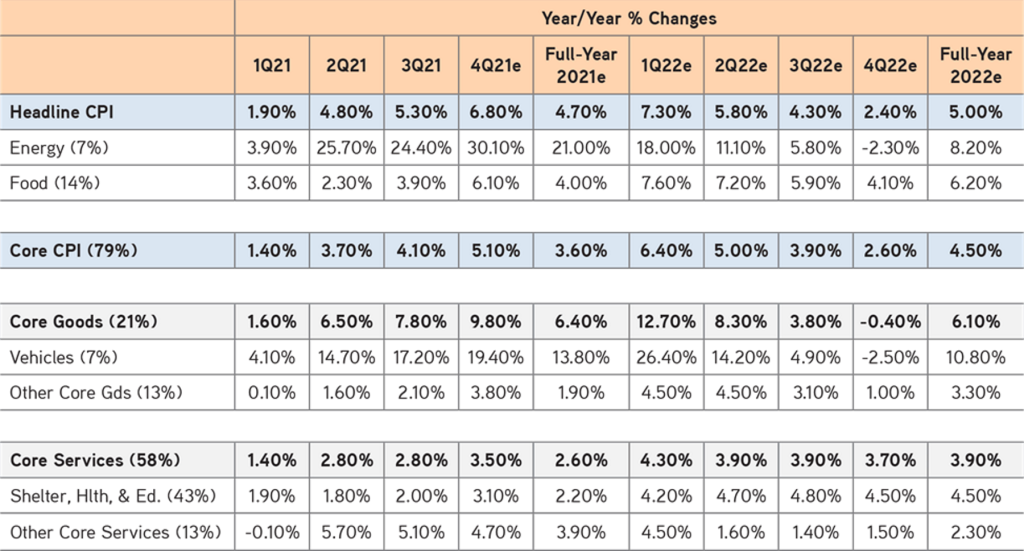
Data as at November 15, 2021. Source: Census Bureau, Haver Analytics, Zinqular Insights & Research Hub analysis.
Therefore, we believe the nominal GDP will be about 9% in 2022. And so, not all firms will be winners. We think, one will require strong pricing power, unit volumes, and technological edge to offset some of the macro headwinds, energy costs specifically that could affect the economy by 2Q2023.
Exhibit 35:
We See GDP Substantial Boosts In 2022 Due To Easy Financial Conditions, Excess Savings, & Wealth Effects…

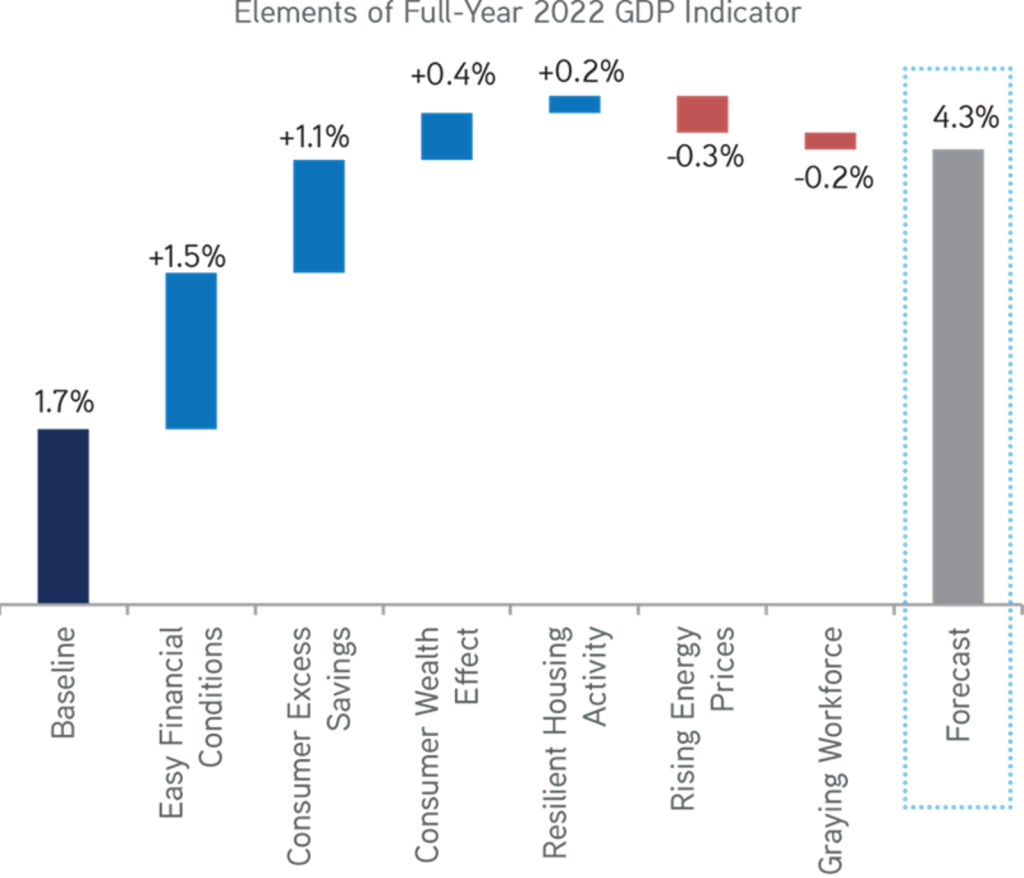
Our GDP leading indicator is a combination of eight macro inputs that in combination we think have significant explanatory power regarding the U.S. growth outlook. Data as at November 15, 2021. Source: Federal Reserve, Bureau of Labor Statistics, National Association of Realtors, ISM, Conference Board, Bloomberg, Zinqular Insights & Research Hub analysis.
Exhibit 36:
High Energy Prices & Labor Force Pressures Will Offset These Tailwinds Over A Period.

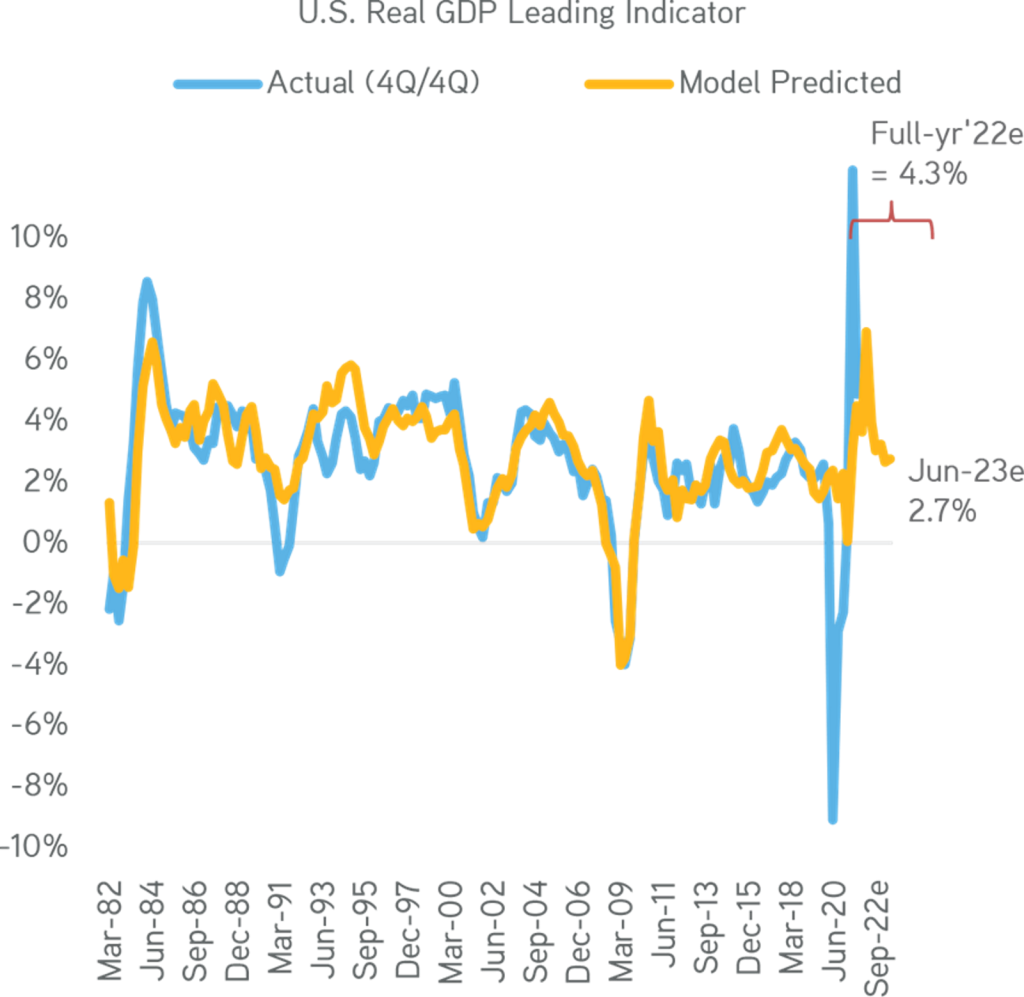
Data as at December 6, 2021. Source: Federal Reserve, Bureau of Labor Statistics, National Association of Realtors, ISM, Conference Board, Bloomberg, Zinqular Insights & Research Hub analysis.
As a firm we work hard to discern the future and direction; we find tools that helps us achieve our long tail investment view regardless of cycle. We use tools to distinguish patterns, test our assumptions, locate & confirm where we are, and forecast the future down the line in the economic cycle. For instance, Exhibit 37 shows a model indicating that we are largely mid-cycle from an economic viewpoint and expect to remain so until financial conditions start to tighten and growth momentum declines further.
Interestingly, this model flagged as leading and lagging in this cycle. On the one hand, the depressed inventory-to-sales ratio suggests supply chain issues are still preventing this cycle from achieving its full potential. This point of view is line with our larger belief that supply, not demand, headwinds are our present concerns – therefore, our pricing power theme. Alternatively, the job quit rate, declining consumer sentiment, and flatness of the 5s/30s yield curve suggests we are more later-cycle. We interpret these various inputs and its elevated inflation rate as eroding the perceived consumer purchasing power. At the same time investors are also betting that the Fed may tighten more quickly over time, which may lead to slower growth down the road. Next, it shows the huge demand that insurers have for longer-tail liabilities as well as our macro view that inflation will ultimately rest at a higher rate this economic recovery.
Exhibit 37:
Mid-Cycle Of Post-Pandemic Economic Recovery

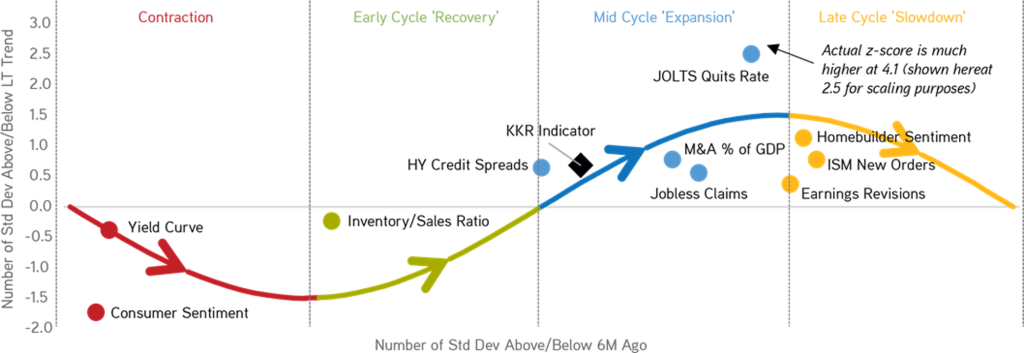
Data as at December 17, 2021. Source: Bloomberg.
Exhibit 38:
Faster / Stronger Mid-Cycle Recovery Than Previous Ones

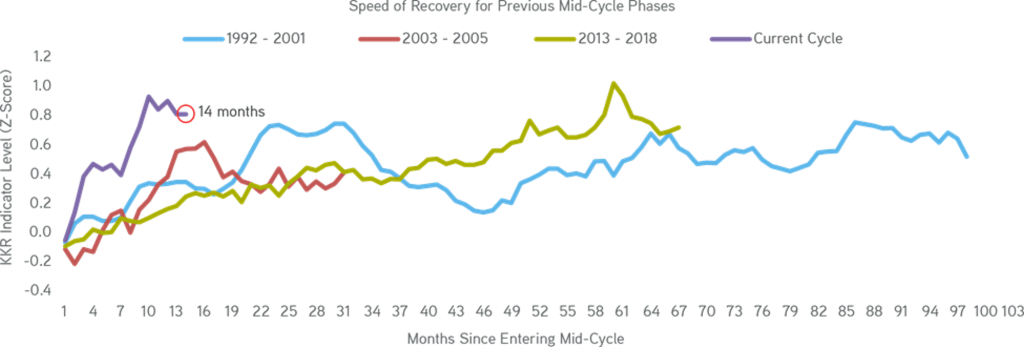
Data as at December 10, 2021. Source: Bloomberg.
Eurozone Outlook
We think expansionary fiscal, monetary policy and strong domestic demand will continue to provide support for Euro Area GDP growth. We forecast 2022 Real GDP growth rate of 4.0%-4.1%, which compares to a consensus forecast of 4.2%. At the same time as headline number appears compelling, Euro area is actually underperforming its near-term potential. For instance, manufacturing production continues to suffer from low supplies of raw materials and key components, poor shipping/freight availability, and port congestion. In addition, exports are still under pressure due to COVID-related slowdowns globally and specifically in China. In 2023, we expect growth deceleration, because post-crisis liftoff runs out of momentum and the impact of expansionary policy cools. That means we call 2023 Euro Area Real GDP growth of 2.4%.
Exhibit 39:
Eurozone GDP Growth Have Peaked. There Is Strong Domestic Demand, Expansionary Fiscal & Monetary Policy

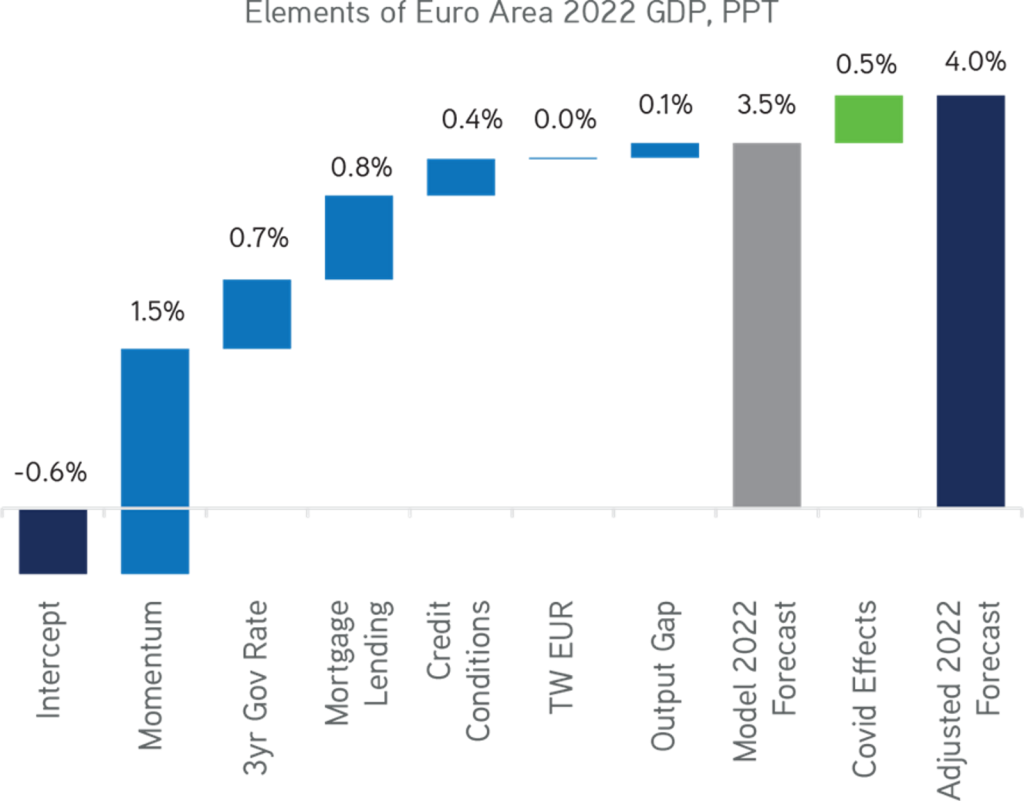
Data as at December 12, 2021. Source: Zinqular Insights & Research Hub analysis.
Consequently, consumer demand should remain strong this cycle. Narrow spending opportunities, combined with incomes that were largely protected from the downturn by government intervention, have increased household savings to levels that are now way above pre-pandemic levels. We understand the increase in prices could weigh on consumer spending in the near term as real incomes continue to be squeezed, but we do not expect these headwinds to materially dent the recovery. Just consider that household consumption in the Eurozone lies some seven percent below pre-pandemic levels (as at 2Q2021); yet, future spending expectations are now back to almost pre-COVID levels as detailed in Exhibit 40. We see plenty of room for catch-up spending, particularly when one factors in high savings. The downside risk once again this year is that moving forward, COVID levels force more severe restrictions than we anticipate. With lockdowns being reinstated or considered throughout many parts of Europe, this scenario is increasingly a clear and present danger in the near-term. But we are hopeful it diminishes as we move through 2022, with vaccination booster campaigns again in full swing.
Exhibit 40:
In 2022, Eurozone Household Spending Expectations Point To Strong Consumer Demand

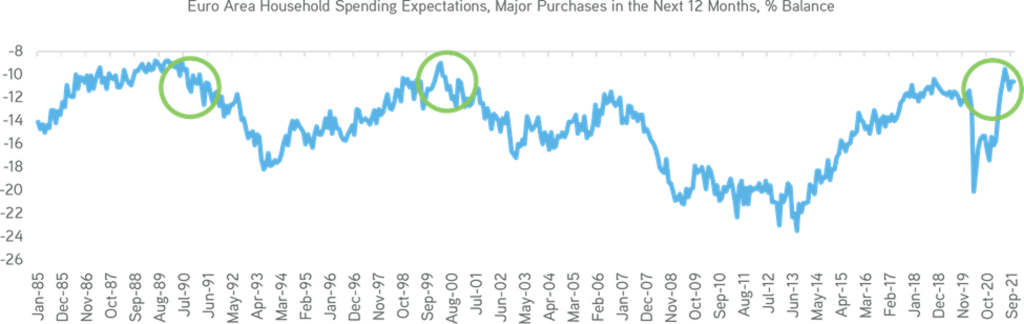
Data as at October 31, 2021. Source: European Commission, Haver Analytics.
Exhibit 41:
Huge Drop In German Manufacturing Inventories Are Due To Supply Chain Pressures.

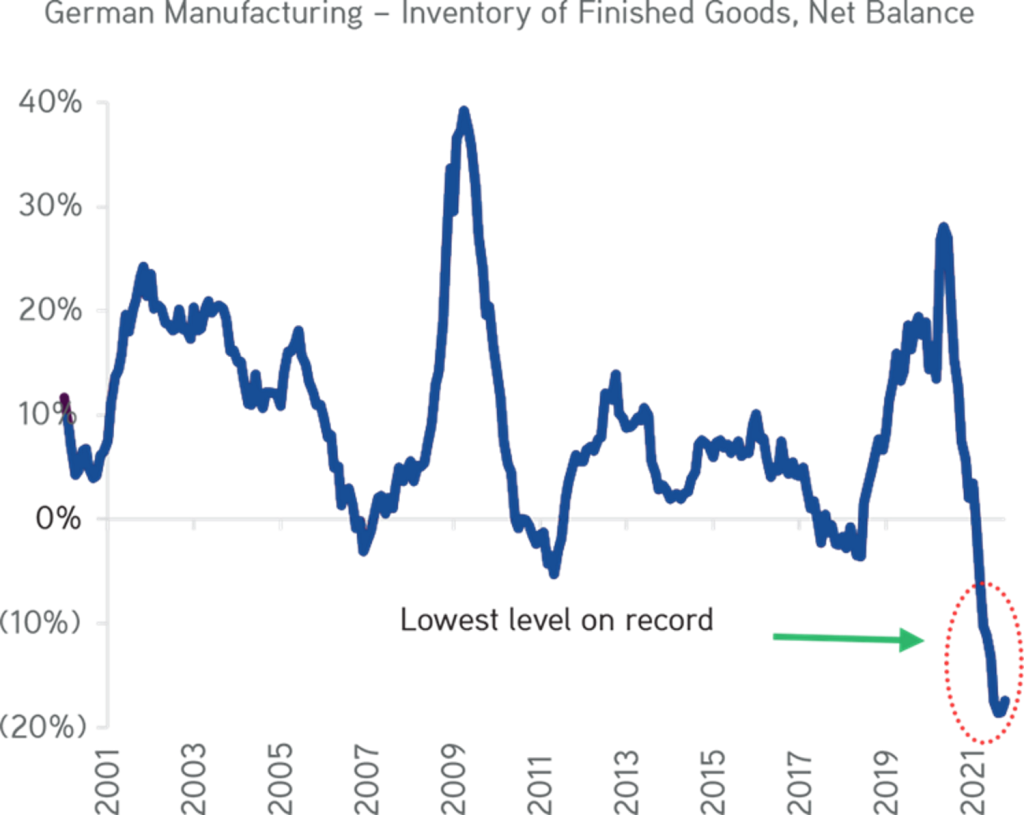
Data as at November 20, 2021. Source: Institute for Economic Research, HIS Markit PMI, Haver Analytics.
Exhibit 42:
Data Suggests Continuous Fiscal Support Across Europe

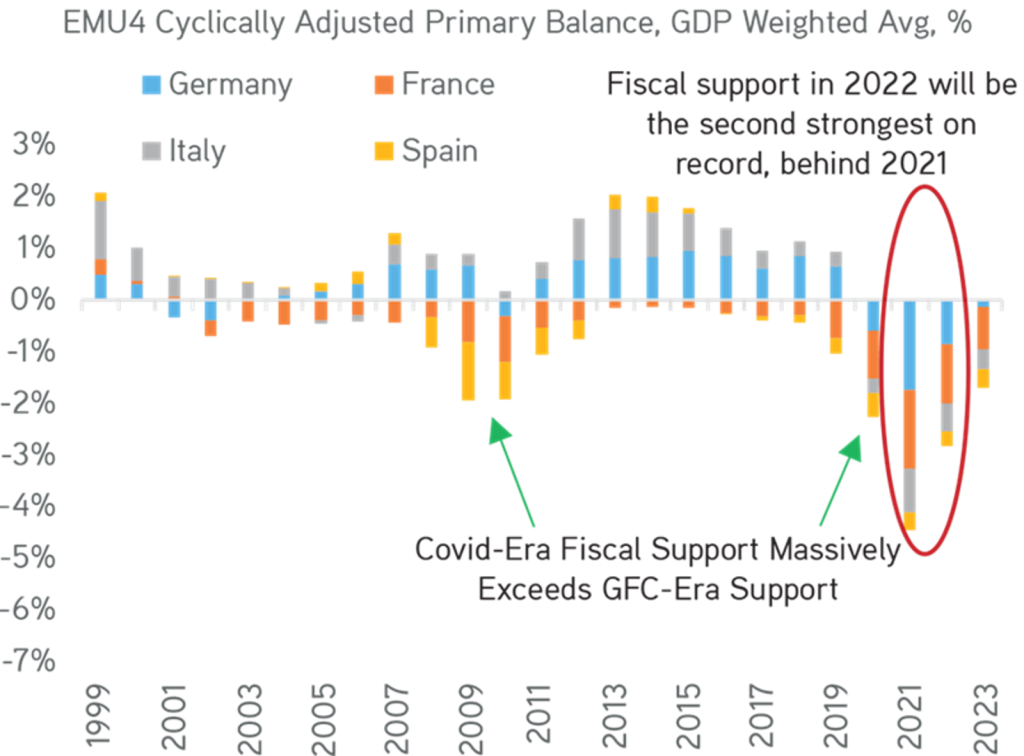
Data as at November 12, 2021. Source: Statistical Office of the European Communities, ECB.
Exhibit 43:
2022 Inflation Will Be Strong Around 2.5%

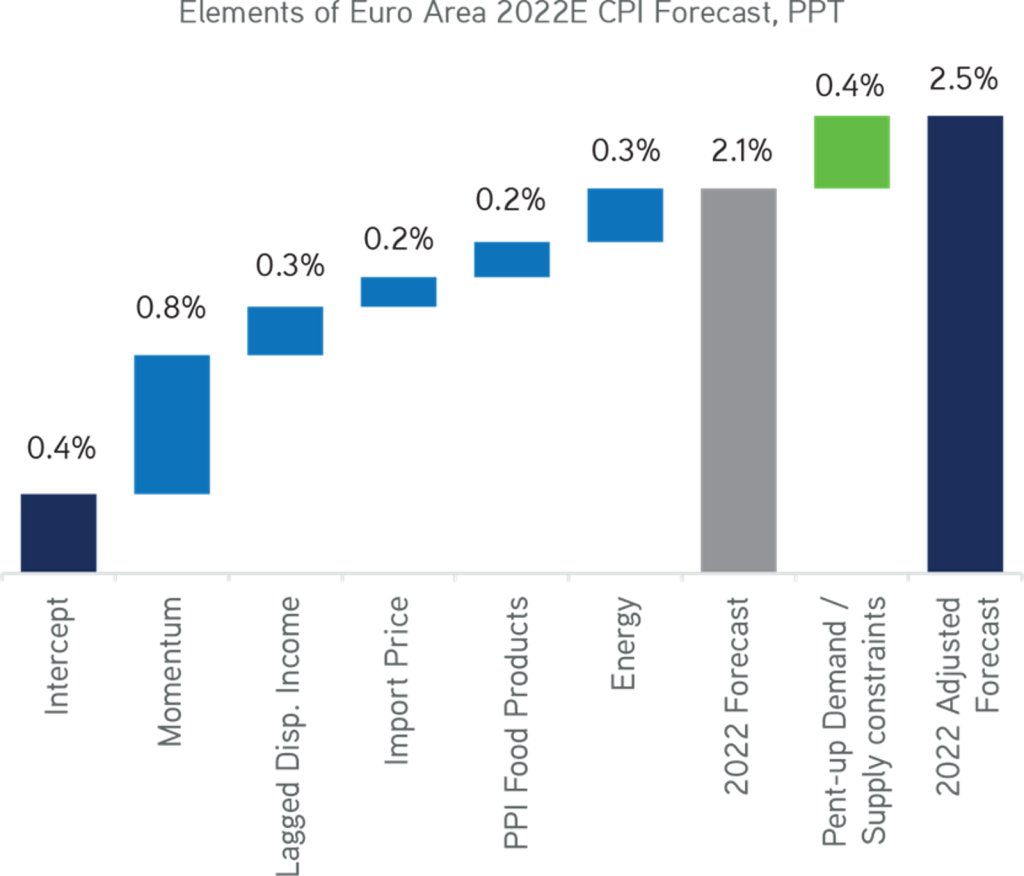
Data as at December, 2021. Source: Zinqular Insights & Research Hub analysis.
With respect to inflation, we remain solid in the near-term, at least relative to what the Eurozone had pre-COVID. The present round of Eurozone inflation is strongly condensed in volatile items such as energy and commodities, a backdrop we expect to continue for some time. And so, for 2022, we think Eurozone inflation will reach 2.5%, before falling back to 1.8% in 2023.
Asia Outlook
Compared with the V-shaped rebounds that we have witnessed recently in many developed countries & economies; growth in Asia has been more lukewarm relative to trend recently. Two key metrics enable this divergence. Firstly, is the pace of vaccinations, which has lagged in Asia relative to the Europe and United States. As a result, governments and health authorities-imposed mobility restrictions to safeguard their populations, which has held the recovery back.
Secondly, many Asian economies that were the first to recover in 2020 are now further along in their cycles versus other parts of the world. For instance, China was the first to rebound after the pandemic, and as a result, it actually started tightening monetary policy in 2020. this strong growth early in the cycle allowed the government to tilt its priorities more towards structural reforms in 2021 versus protecting employment through fiscal stimulus as the U.S. did.
In Korea, which had the advantage of strong semiconductor cycle early in the global recovery, is now in the phase of an interest rate tightening. The Bank of Korea hiked rates twice and is set to raise rates more. In short, we do not envision central bankers going overboard on tightening financial conditions, given the slowing growth profile in the region.
Exhibit 44:
Delta Wave Impacted Growth Across Asia In Various Ways
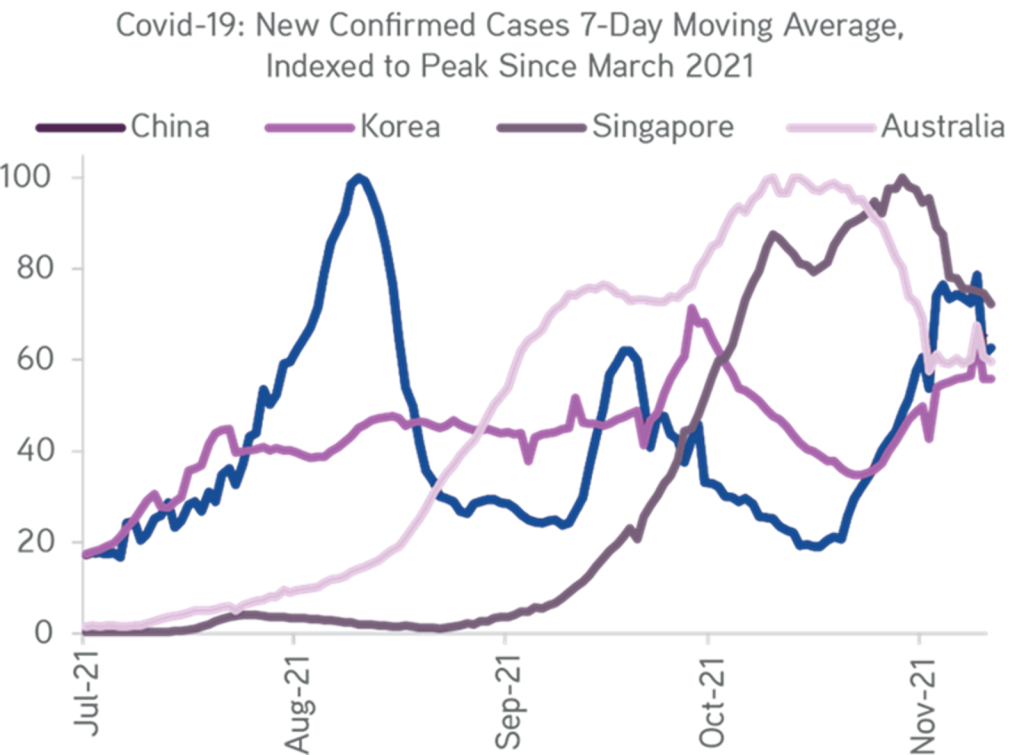
Data as at December 15, 2021. Source: Bloomberg, Zinqular Insights & Research Hub analysis.
Exhibit 45:
Commodity Prices Will Likely Raise This Cycle

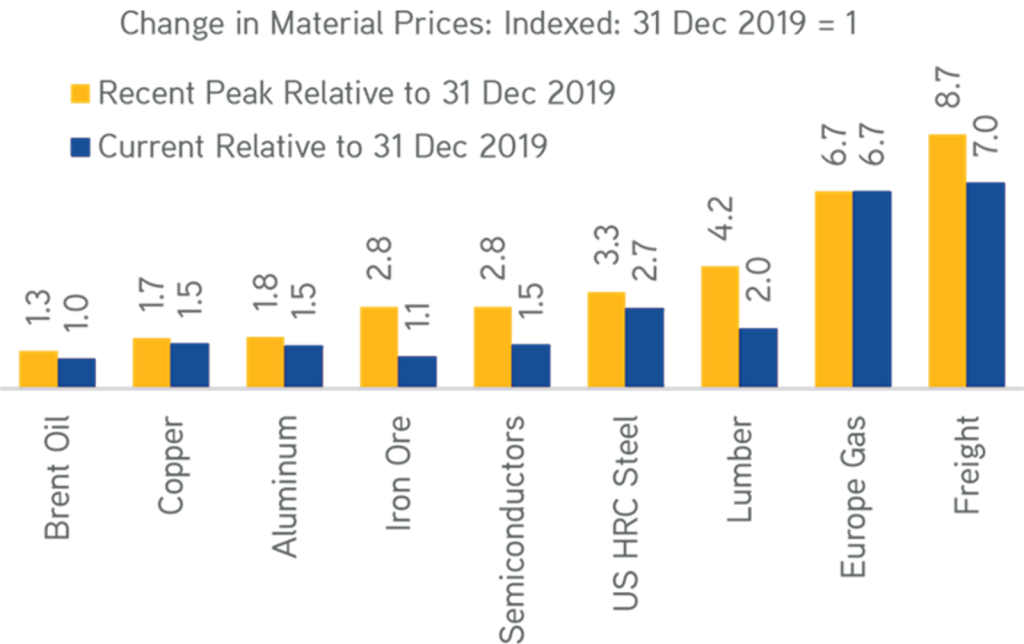
Data as at November 30, 2021. Source: Bloomberg, Haver Analytics, Zinqular Insights & Research Hub analysis.
As we gaze into the future, we will focus on China as an important enabler of growth globally and in the region. We expect 2022 China Real GDP growth to slow to 4.8% in 2022, slightly below consensus of 5.3%, which is much lower than 8.0% growth enjoyed during 2021. One can see this in Exhibit 48.
Our interpretation to our forecast being below consensus is first, we are more bearish on property-related themes; second, a massive easing cycle in 2022 is unlikely; third, we think the zero-COVID policy will outlast 2022; and fourthly, we anticipate a range of heavy industrial shutdowns in Northern China linked to the Winter Olympics. Relating to 2022 timescale, we think that growth momentum will likely slow further into 1Q2022 before bottoming out in 2Q2022.
Exhibit 46:
Continuous Growth For China’s New Economy, Estimated 20-35% Of Total GDP

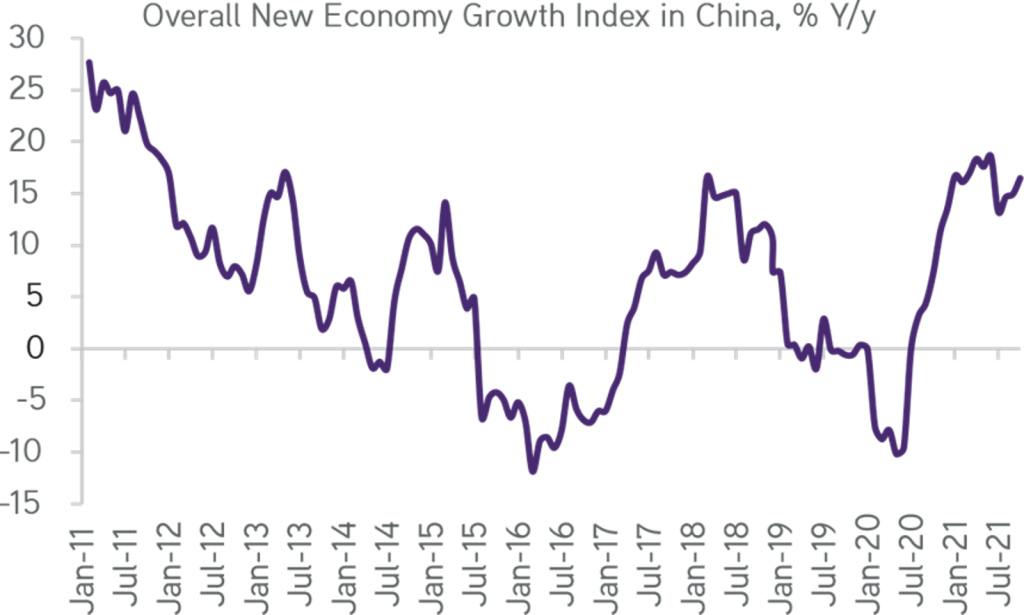
Data as at December 7, 2021. Source: PBoC, UBS, Bloomberg, Zinqular Insights & Research Hub analysis.
Exhibit 47:
Over 31% Increase In Global New Trade From Pre-COVID Levels, Despite Lockdown Recurrence

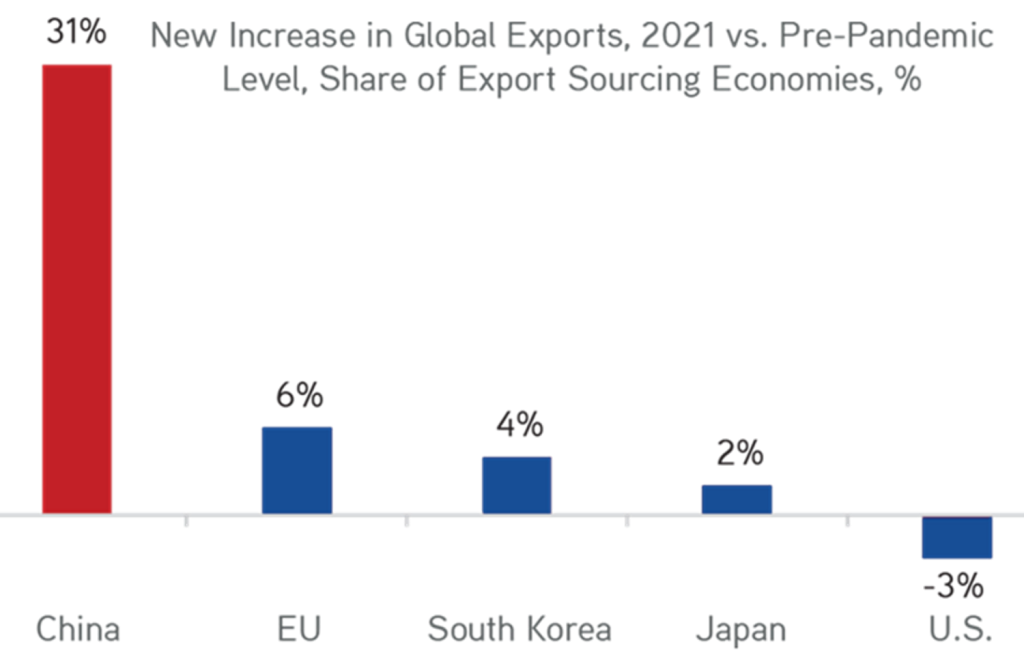
Data as at December 6, 2021. Source: China General Administration of Customs, IMF, Haver Analytics, Zinqular Insights & Research Hub analysis.
But in spite of that, we think of no hard landing in China either, as policy easing has started (e.g., the December RRR cut) and will likely speed up a bit. Important new initiatives such as the energy transition and digitalization will support exports and the manufacturing sector, partly offsetting the property sector-related slowdown, reference Exhibits 46 and 47, respectively. Similar to Europe and the U. S., consumption should also get some support from excess savings and the overall health of the Chinese consumer. We estimate that excess savings in China are equivalent to 19% of annual retail sales. In addition, the labor market is still tight. Strong global growth, particularly in the U.S., should bolster exports, though its contribution will not be enough to fully offset the weakness the country is expecting in the property sector (Exhibits 50 and 51).
Exhibit 48:
Probability Of Slower Structural Growth In China Due To Greater Focus On Regulation & Environment.

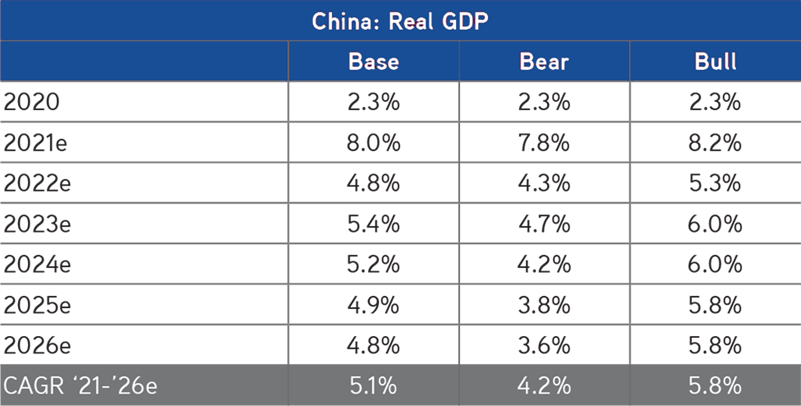
Data as at December 18, 2021. Source: Zinqular Insights & Research Hub analysis.
Exhibit 49:
China’s Inflation Will Slowly Move Up In 2022

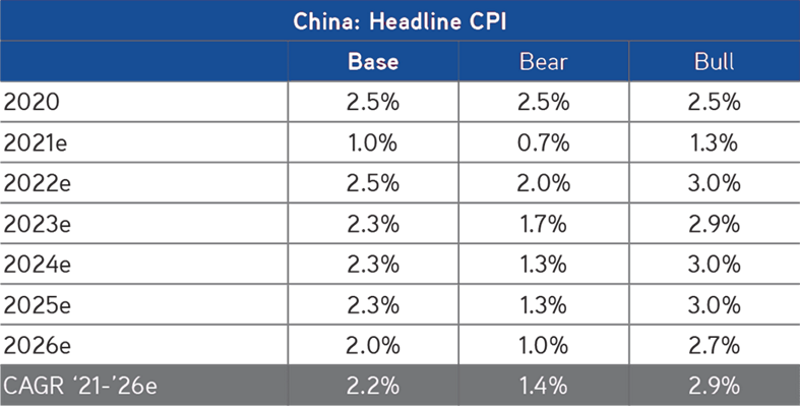
Data as at December 9, 2021. Source: Zinqular Insights & Research Hub analysis.
We expect inflation to raise to 2.5% in 2022, up sharply from 2021 and in line with pre-COVID rates. Our 2023-2025 base case inflation growth is 2.3% (Exhibit 49).
The big picture in China is energy transition theme. China has exit Phase I of its agenda (2012 to 2020), a period linked primarily to the government’s heavy pursuit of doubling GDP. In phase II, China is focusing on ‘common prosperity’ and the doubling of the middle-income population from 400 million to 800 million. To achieve these new goals, governmental policies are now concentrating on innovations, general-purpose technologies, a priority that ensures inclusive growth for all citizens while also building greater societal resilience and national security.
Consequently, the Chinese government is willing to allow somewhat weaker growth to achieve these ambitions. This mindset is quite different than before, and we think it definitely warrants all investors’ attention.
Exhibit 50:
Major Headwinds Due To Stress In The Chinese Real Estate Sector In 2022…

Data as at November 23, 2021. Source: Wind, Haver Analytics, NBS, CICC, Zinqular Insights & Research Hub analysis.
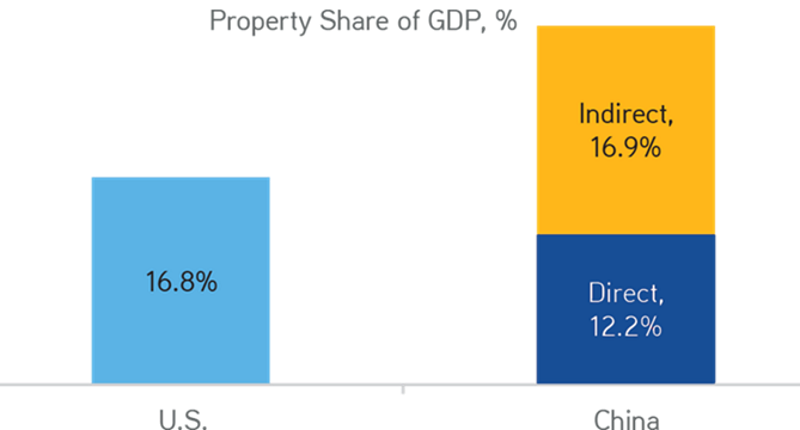
Exhibit 51: Japan Style Bubble Burst For China Is Out Of Question

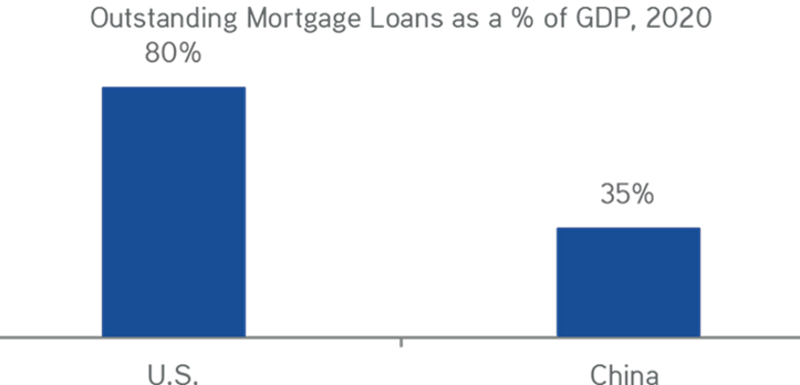
Data as at November 30, 2021. Source: Federal Reserve Board, Bureau of Economic Analysis, PBoC, China NBS, Haver Analytics, Zinqular Insights & Research Hub analysis.
Emerging Market Outlook (Minus China & S. Korea)
The upshot is that we expect EM GDP growth to slow to 4.5% in 2022, down from 6.5% in 2021. EM economic growth will be slower in 2022. Many of the economies have already recovered to pre-pandemic levels, and this naturally makes it harder to sustain above-trend rates of growth. This is likely to be negative for small, open EM economies across Asia, in parts of Central and Eastern Europe along with Mexico.
Similarly, subdued real estate sector activity in China leads to softer demand for commodities such as industrial metals, this would hit the exports of economies in Latin America and Sub-Saharan Africa.
Going into 2022, emerging markets are far better equipped to deal with Covid-19 than a year ago. The vast majority of EM are on track to inoculate large proportions of their population in the coming months though. This should be clearly beneficial with respect to ongoing recovery in economic activity. This should benefit services-based economies in particular, especially those that rely heavily on tourism.
Exhibit 52:
EM Vaccine Rollout Are Going Very Well

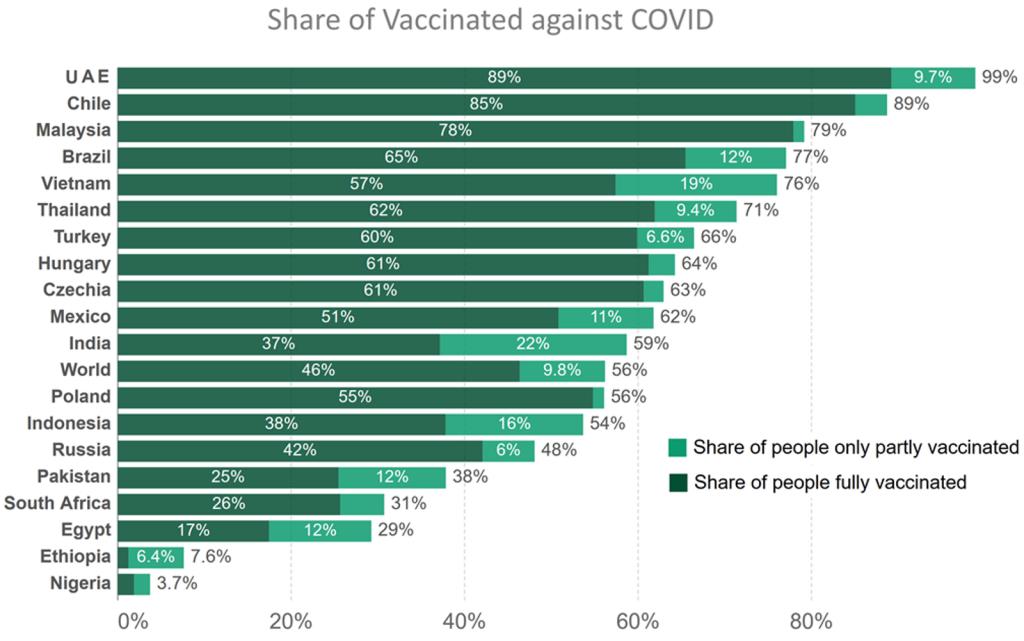
Data as at December 14, 2021. Source: Collated by “Our World in Data”, Zinqular Insights & Research Hub
Regarding EM equities; Fed policy tightening will certainly cause headwinds, but EM are more resilient when compared to the last Fed hiking cycle (See Exhibit 53). External accounts are typically in good shape, recent capital inflow has been less “hot” than in 2013, EM currencies are generally looking cheap, and the yields on EM local debt are relatively attractive.
Exhibit 53:
EM Economies Resiliency In Upcoming Fed Tightening

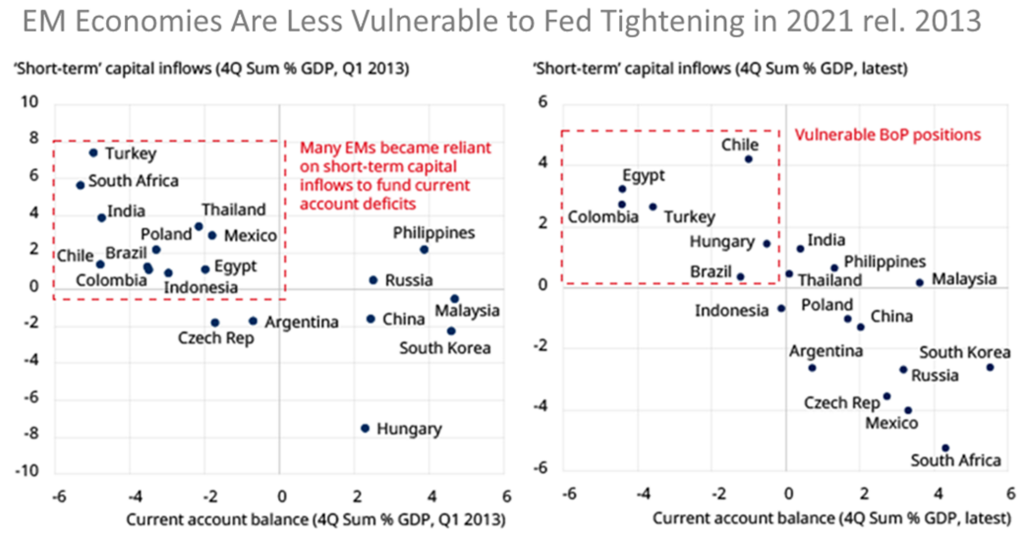
Data as at November 2021, Source: Refinitive, Schroders Economics
In terms of valuations, EM valuations on aggregate are not cheap relative to history. This however, masks considerable variations in terms of country, sector, stock and investment style. There is also some uncertainty over company earnings next year, stemming from economic growth pressures, fed by monetary policy tightening. Valuations when compared to the US, however, look more attractive, while various EM currencies are looking increasingly cheap.
Moving through 2022, we may begin to see a more positive backdrop. Monetary policy has anticipated higher inflation, and real rates look attractive. Should inflationary pressure ease, this could provide scope for monetary easing. Meanwhile, there is potential that China’s economy could begin to improve.
Concerning our market preference, we like the Eastern European EM of Poland; Czech Republic and Hungary, where economic growth is strong and valuations are reasonable. Russia is another market we prefer, given cheap valuations and as it is a beneficiary of higher commodity prices. Geopolitical risks persist though, and with tensions with the West recently rising, we are keeping an eye on developments closely.
Brazil may also present an opportunity in 2022 – valuations reflect elevated political risk and an inflection in inflation may create scope for monetary easing in the latter part of next year.
Regarding Emerging Markets Debts (EMD), the Fed’s bond tapering policy means that investors this time are not looking at a 2013-2015-like two lean years as the Fed follows a similar format.
While investors might fear the effects of higher US interest rates, markets are discounting it and a lot has been priced in. Exhibit 54 shows that kick-off of the last hiking cycle in Dec.2015 coincided with a recovery in local market returns for investors that lasted two years. This cycle – from talking about tapering, to tapering, to lift off – is on track to be to be much shorter, suggesting a high percentage of pain has been priced.
Exhibit 54:
Expect Positive EMD Returns

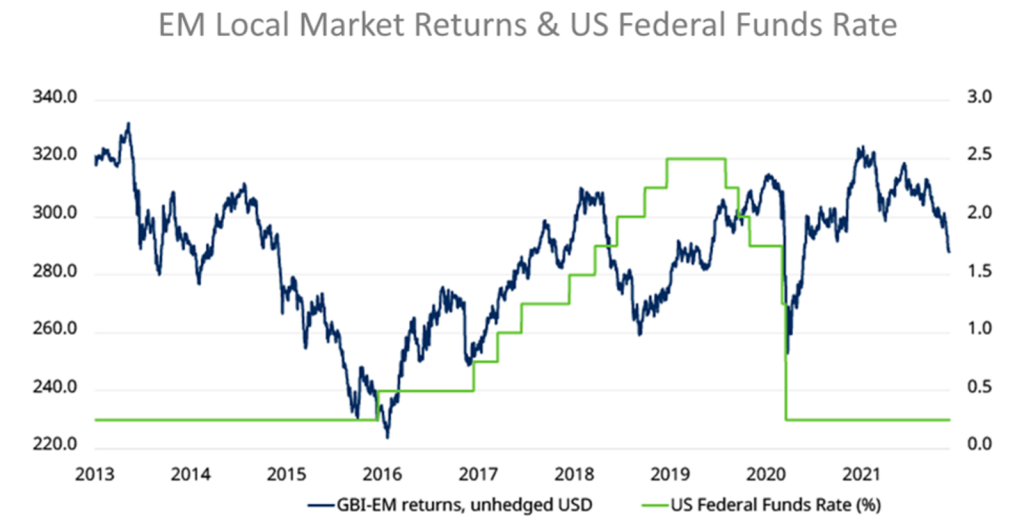
Data as at December 4 2021, Source: Bloomberg
The dollar is about 19% higher than it was at the start of the previous cycle. EM central banks have been pre-emptively hiking for many months, widening the nominal rates difference with the developed world. And currencies have, by and large, never fully regained their real valuation levels from before the first tapering cycle. Valuations are much brighter this time around.
We think that if inflation moderates and returns close to central bank target levels in 2022, then the outlook for local currency EMD investors could be very bright. Over the course of this year, the local EMD market yield, as measured by the GBI-EM Global Diversified Index, rose from 4.2% to 5.65% as hiking cycles progressed. The spread – or difference in yield – to similar duration Treasuries has soared to just over 430 basis points.
The most highly credible central banks, such as Russia and Mexico, will likely be the first to tap the brakes on hikes. Others in central Europe and Brazil will take months more to corral inflation trends. Asian countries are closer to developed market credibility than other EM regions and while local yields are lower, currency volatility is also much more subdued. Over the course of 2022 we expect virtually the entire asset class to have completed hiking cycles and be left with real interest rates well above developed counterparts, perhaps with rate cutting cycles coming into view.
Currencies will have to co-operate with bullish rates view for most investors to be lured into investing. The stability of China’s renminbi, where real rates – that is net of inflation – are the most positive in the asset class, signals that positive rates are a powerful lure despite significant sovereign issues. We also favor Malaysia and Indonesia in the region on a similar basis. The Russian Rouble looks nearly bullet-proof with strong external accounts. In Latin America, Mexico is the standout given proximity to the US and a lack of fiscal strains.
On the dollar debt side the prospects are less bright. In investment grade EMD the yield spread to US Treasuries is historically low, yet still offers a modest pick-up to similarly rated developed debt which has anchored stability. High yield EM bond spreads are more attractive than US high yield but lack the stable operating environment. Being active and taking a selective approach is key. Some lower rated credits will struggle with funding requirements and the need for fiscal tightening (many sub-Saharan and frontier countries). Others might not be default candidates but will struggle with the politics of regaining debt sustainability as both growth and spending slows.
Exhibit 55:
While China’s Overall Exports Are Growing, Its Exports To The U.S. Could Be At Risk To Mexican Competition

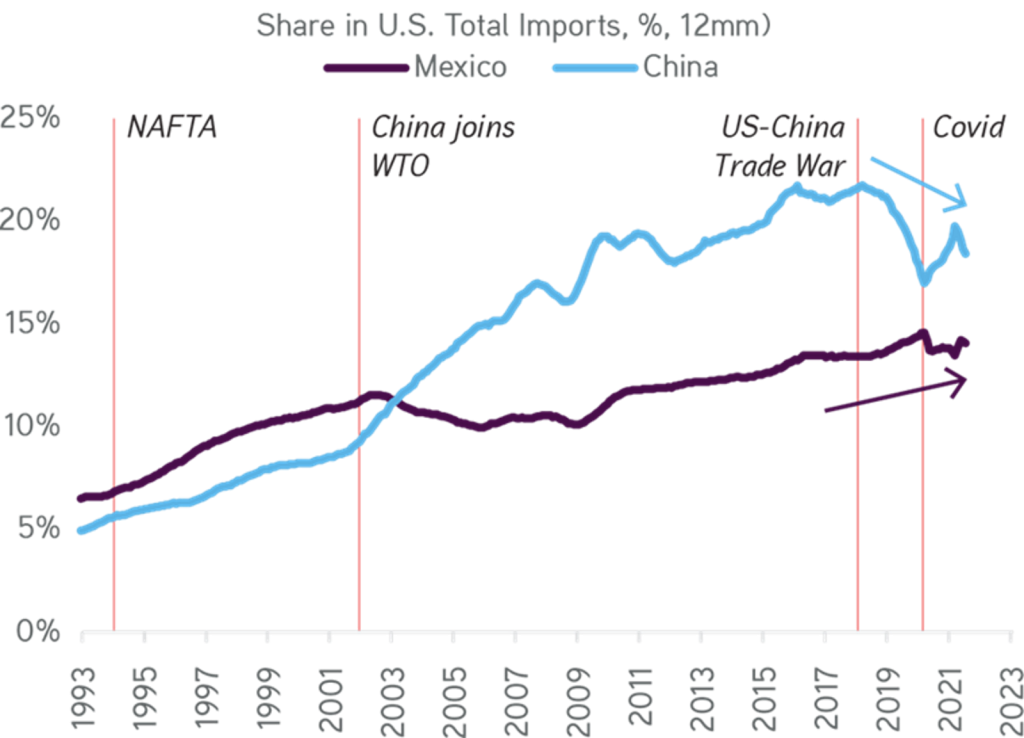
Data as at December 14, 2021. Source: Bloomberg, Haver Analytics, Banxico, INEGI.