

Authors: Barry Simon Graham (Co-CIO) and Michael Yaw Appiah (Co-CIO)
[wpfd_single_file id=”1979″ catid=”327″ name=”Global Investment & Economic Outlook 2022″]
Eurozone & U.S. Interest Rates
Most of the global conversation on interest rates starts and ends these days with the US Federal Reserve. The recent Fed development (Congress Testimonies & FOMC meetings), suggest that the Federal Reserve has finally accepted that there is ‘a real risk that inflation could be more persistent’ than previously anticipated. We think there are multiple three drivers of the Fed’s tone shift: (a) broad-based nature of pricing pressures; (b) constrained items like autos have not improved; (c) acceleration of wage inflation; and (d) bond market break-evens remain elevated.
In line with the Fed’s more hawkish view, it has revised its `dots plot’ to show three hikes in 2022 and sped up its QE taper to end in mid-March (vs. June previously). Interestingly the quantitative shift in targets, however, was the Fed’s qualitative shift in tone regarding the persistence of inflation (which was previously termed `transitory’); their recent responses to the threat of inflation represent an historic sea change for this central bank.
In the meantime, a key new factor for us all, including the Federal Reserve and its peers, is the emergence of the future variant of COVID for e.g., Omicron. It is still early in understanding exactly how it will affect the global economy, but our initial thinking is that Omicron will likely presents further inflationary supply shocks, instead of consequential deflationary effects to demand.
We believe the FOMC’s new direction makes sense, as it is much better aligned with the nominal GDP environment we envision. In particular, we believe the Fed is now recognizing the breadth of inflation as well as the ongoing pressures on labor participation.
Now, what does this mean for our rate forecast or prediction? We have moved forward three rate hikes into our 2022 forecast. This speed in timing is enabled by the fact that inflation will run ‘hot’ in the first half of the year of 2022, and that underlying labor demand will remain elevated, even as the participation remains slow to recover and could be hampered further by new COVID waves and possibly variants. After rebound, however, we think the Fed will likely move relatively slowly (in the scope of between two to four hikes per year), at the same time paying close attention on the labor market dynamics. In other words, we believe the possibility of a taper tantrum is already pricing in for 2022 calendar year.
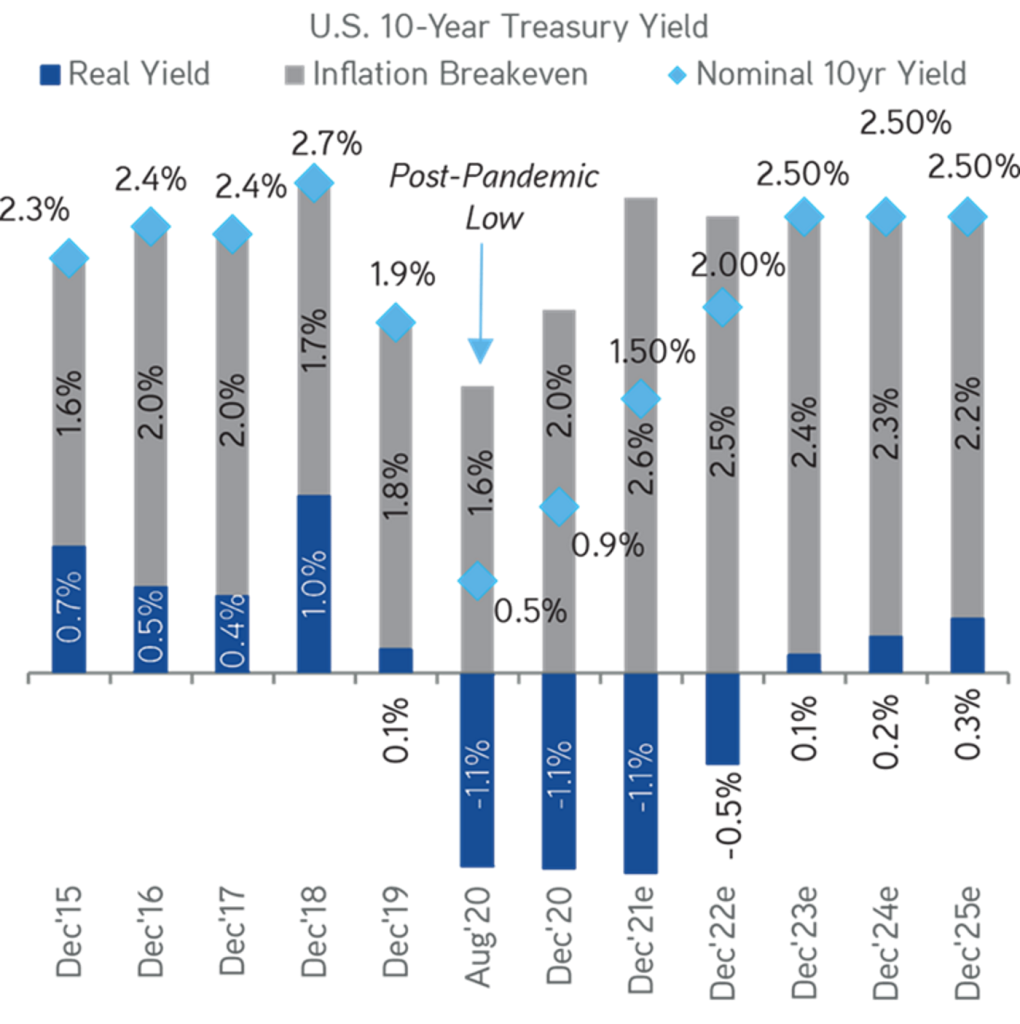
Exhibit 56:
As Nominal Rates Rise; Real Rates Will Remain Below The Pre-COVID Levels

Data as at November 15, 2021. Source: Bloomberg, Zinqular Insights & Research Hub analysis.
Concerning 10-year yields, we have upgraded our 2022 10-year target to 2% from 1.75%, reflecting our accelerated Fed expectations. Currently, the market has treated the potential for accelerated Fed hikes as a curve-flattening event. We believe over time; the market will recognize the underlying quality of nominal GDP and price higher equilibrium rates into the long end of the curve. In fact, long-term rates usually move up only about six months before the Fed starts hiking (reference this in Exhibit 58). That means our believe on the long-end will start to move higher in early 2022. Longer-term, however, there is no change to our target of around 2.5% nominal 10-year rates and 0-0.5% real rates.
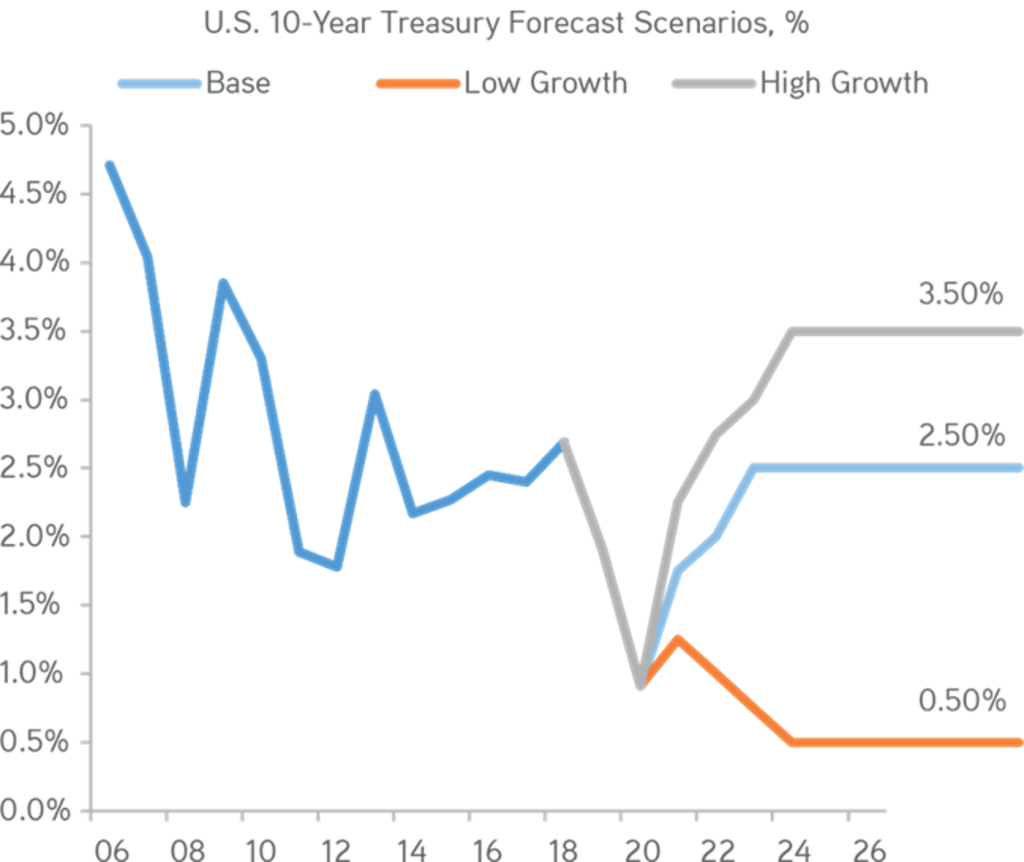
Exhibit 57:
Our Data Models Shows Wider Tails, Suggesting Uncertainty Of Recent Policy Initiatives

Data as at December 8, 2021. Source: Bloomberg, Zinqular Insights & Research Hub analysis.
Exhibit 58:
Usually, the Market Tends to Remain Unconvinced of Fed Tightening Until After 6 Months Before First Hike

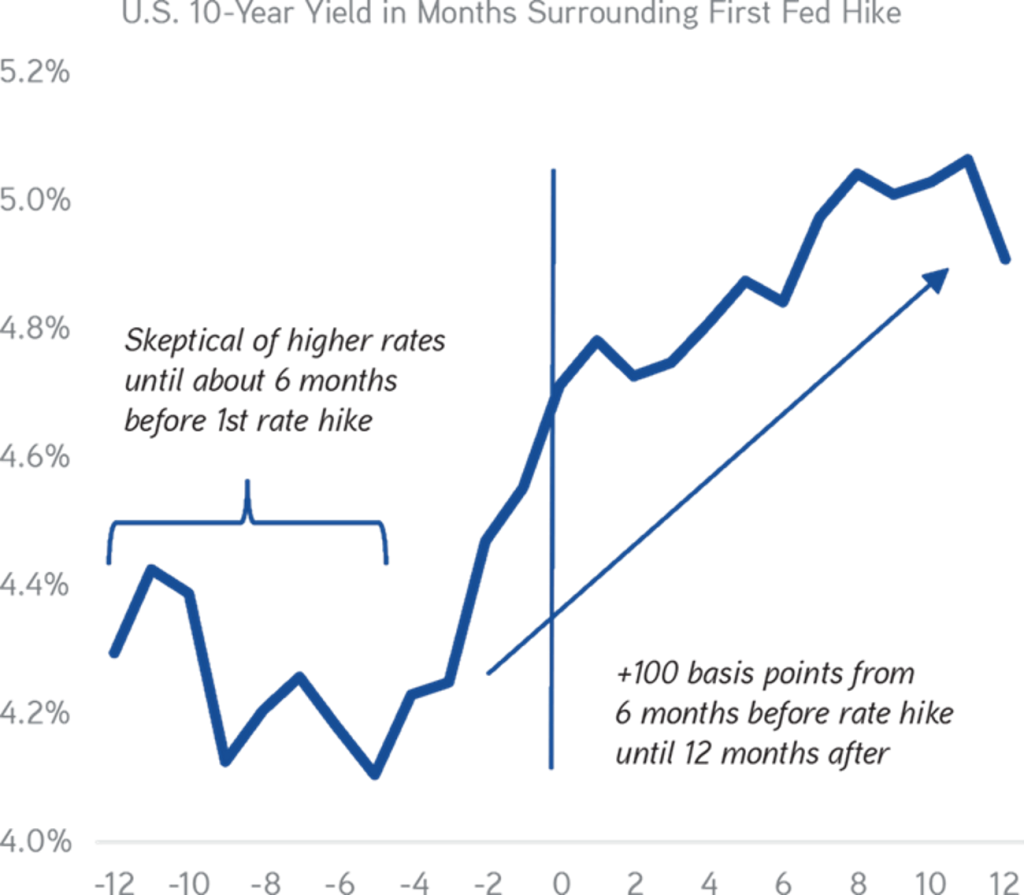
Note: The Mean 10-Year yields in months surrounding first Fed hikes in February 1994, June 1999, June 2004, and December 2015. Data as at July, 2021. Source: Bloomberg.
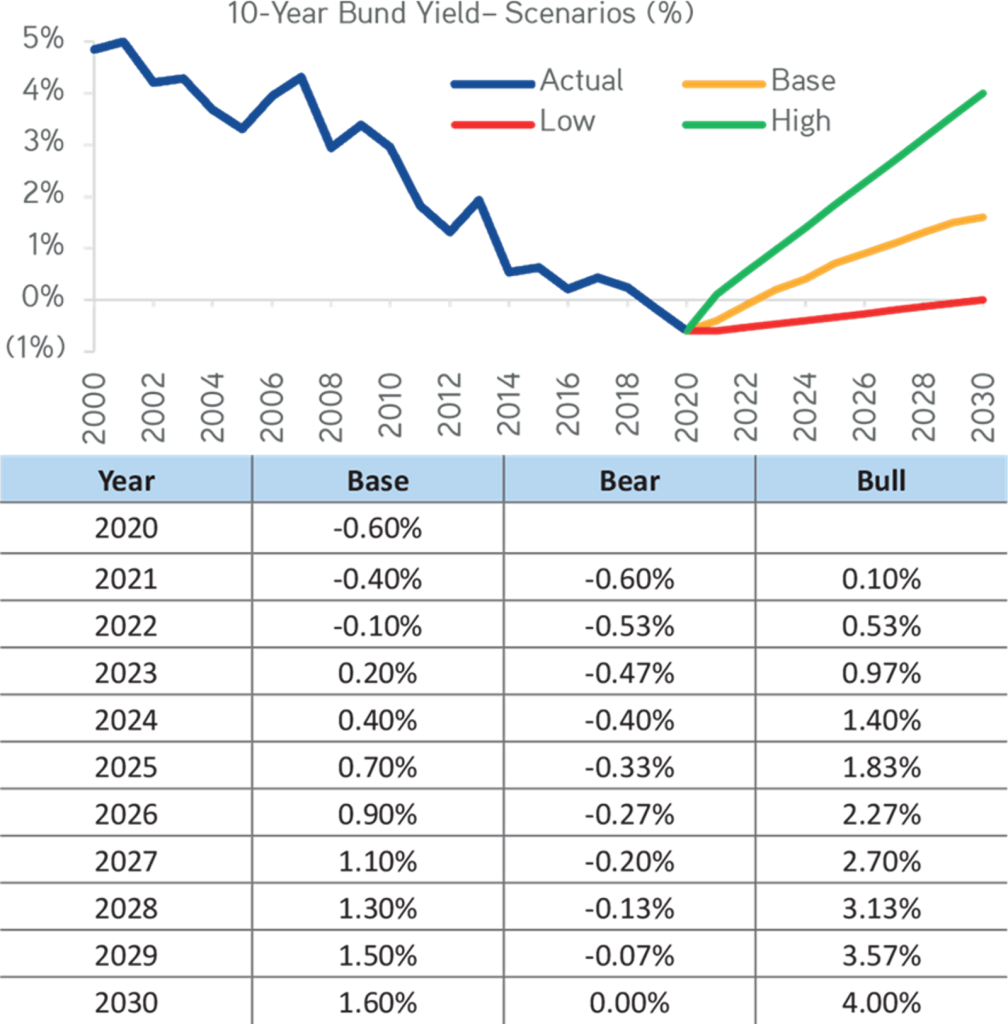
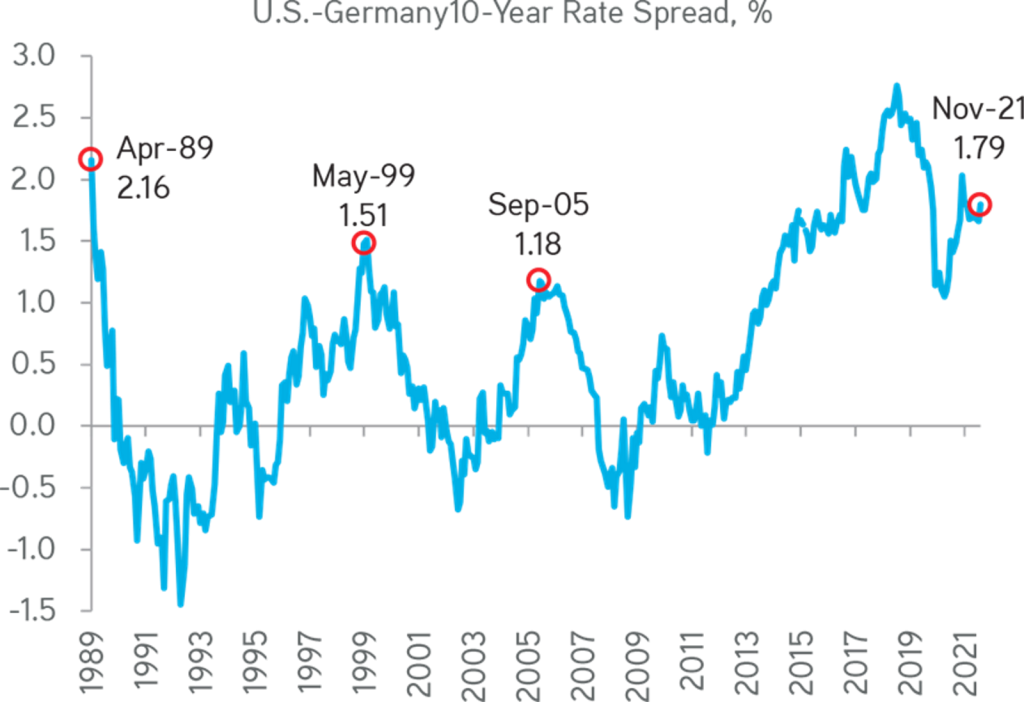
Next, the German bund have our sustained attention, as we believe that the 10-year Bund and Treasury will trade within a band (refer to Exhibit 55). In line with this view, we also look for interest rates to start to back up, albeit at a measured pace. Indeed, similar to our outlook on Euro Area inflation, we do not envisage a sustained breakout in 10-year yields. In Exhibit 57, which shows our forecast of 10-year nominal yields in Germany reaching around zero by the end of 2022, compared to about -35 basis points at the time of authoring this paper. In other words, our base case calls for about a 60 basis-point increase in bund yields by the end of 2023. In fact, we think a full decade of normalization at this kind of pace is a sensible base case.
Exhibit 59:
Seeking Gradual Return To Normalcy For The Bund

Data as at December 8, 2021. Source: Zinqular Insights & Research Hub analysis.
Exhibit 60:
10-Year U.S. Treasury Yield Do Not Uncouple Itself From The German Bund

Data as at December 4, 2021. Source: Bloomberg.
We think that 2022 will be a year of transition for interest rates because they are finally headed higher, albeit we expect some volatility along the way. Nonetheless, we believe that the outsized liquidity in the economy (i.e., the overall stock outstanding of central bank balance sheet holdings) will be enough to support risk assets, despite a more hawkish bent to financial conditions in 2022, including a less attractive ‘flow’ environment in the form of higher short- and long-term interest rates in many parts of the world.
Oil & Gas in Focus: Energy in Transition
Our view is we are bullish on oil price durability. In spite of concerns COVID variants undermining growth, we are still optimistic about the long-term fundamentals for oil. We think that both the energy transition and ESG activism are constraining supply growth much more than demand, creating a structurally supportive backdrop for longer-term oil prices. Some factors influence our believe:
- In general, we are observing a structurally altered price versus supply function, primarily due to a) continued capital restraint; and b) a surge in climate activism in the post-pandemic era.
- Physical markets continue to improve as the global demand recovery from the post – Delta impact has been faster-than-expected.
- The technical backdrop for crude oil trading remains supportive despite the robust rally; speculator positioning actually tilts net cautious, which is contrarian bullish.
- We expect continued OPEC+ cohesion to maintain healthy supply/demand, particularly given the surprisingly settled U.S. shale rig count.
In reference to Exhibit 64, our current expectation is for WTI to average around $81 per barrel in 2022, in the $72s in 2023, and to center around the mid-to-high $60s longer term. We accept Omicron presents a near-term headwind. Even under a fairly conservative case involving curtailments of international travel as well as some reduction in domestic mobility, we still estimate oil demand destruction will likely only amount to 1.2+ million barrels a day over few months. This scenario leads to a price headwind of less than $5 per barrel in our fair value estimates – something that the market has more than discounted, given the more than $15 per barrel decline in WTI between early and late November. In general, our forecasts suggest a moderately declining price trend in coming years, but are still quite bullish relative to what is priced into futures today, and therefore bullish for energy equities.
Exhibit 61:
Oil Price Recovery Not Reflected On Shale Rig Count

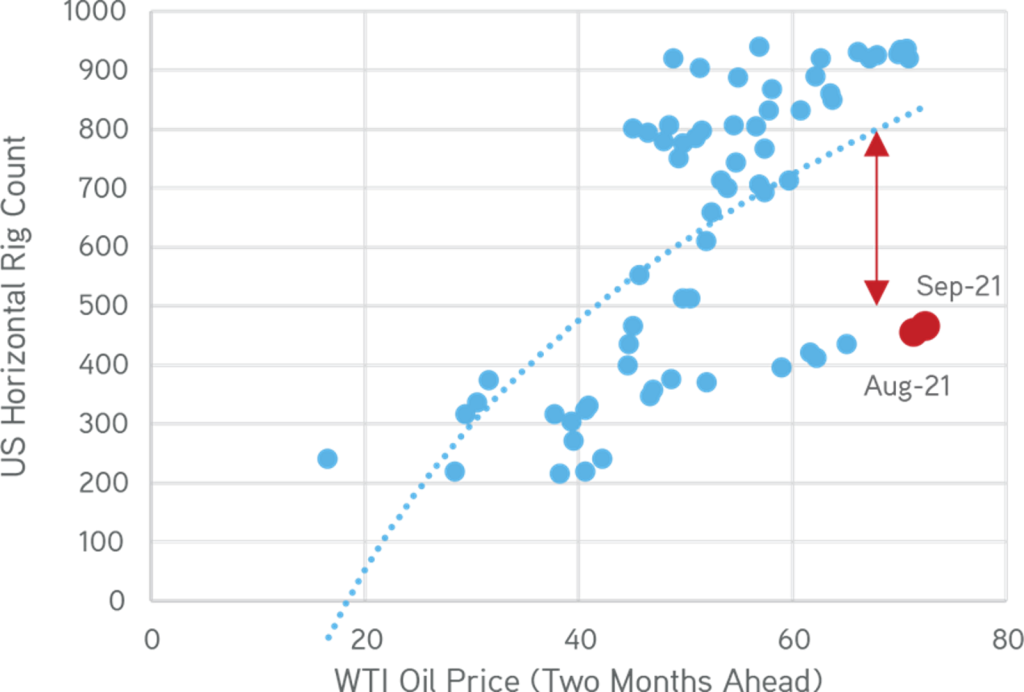
Data as at October 23, 2021. Source: Baker Hughes, Bloomberg, Zinqular Insights & Research Hub analysis.
Exhibit 62:
Current Upstream Spending Plans Suggest Over $600 Billion Capex Shortfall By 2030, Risking Oil Price Hikes

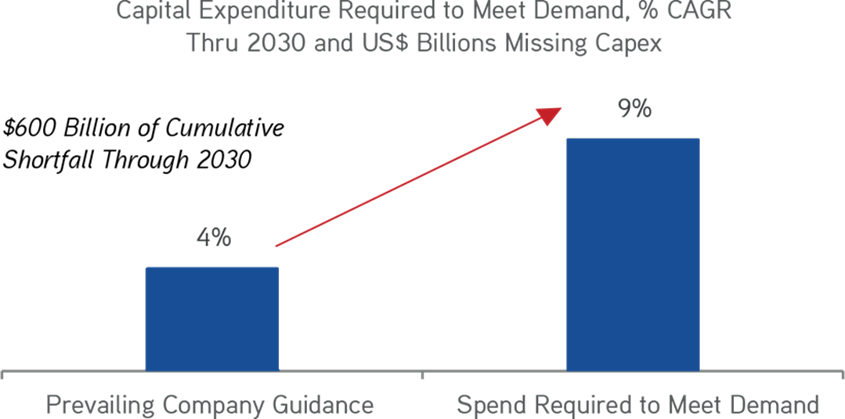
Data as at November 3, 2021. Source: JPM estimate of capex required to meet demand.
Exhibit 63:
Based On Our Model Connecting OECD Inventories To Crude Time-Spreads, We Think Oil Prices Will Average $70+ Per Barrel In 2022 & Mid-$60s In 2023

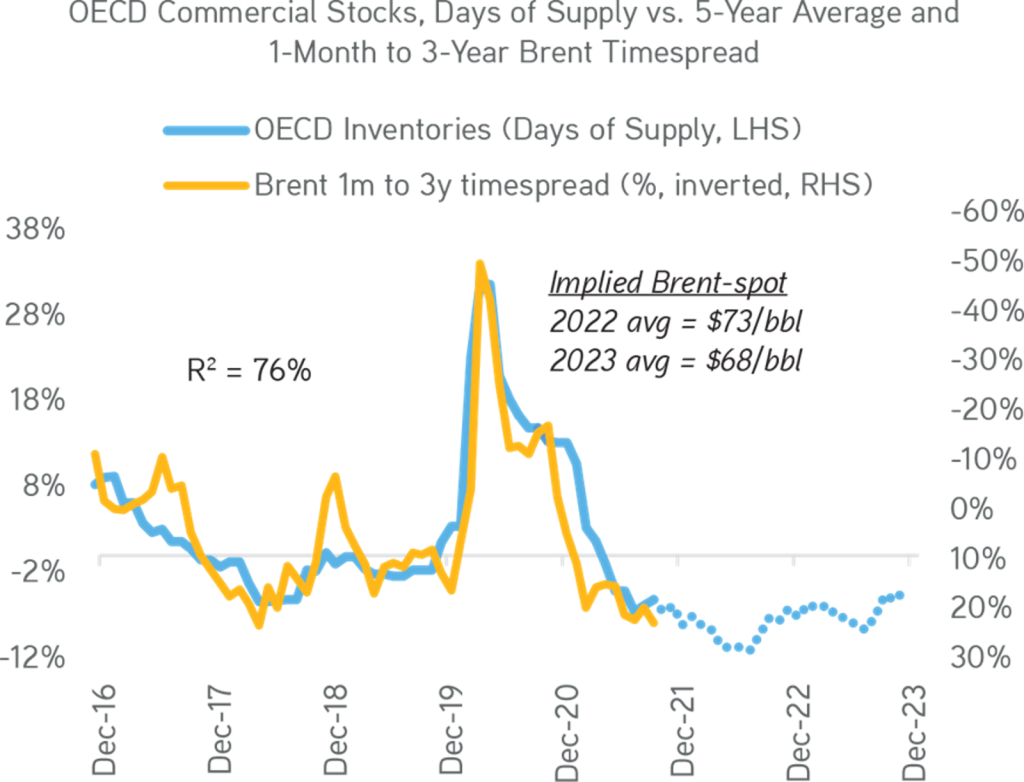
Data as at November 15, 2021. Source: Energy Intelligence.
Exhibit 64:
We Are Raising Our Price Targets To Reflect Our Higher Conviction In The Structural Improvement Narrative

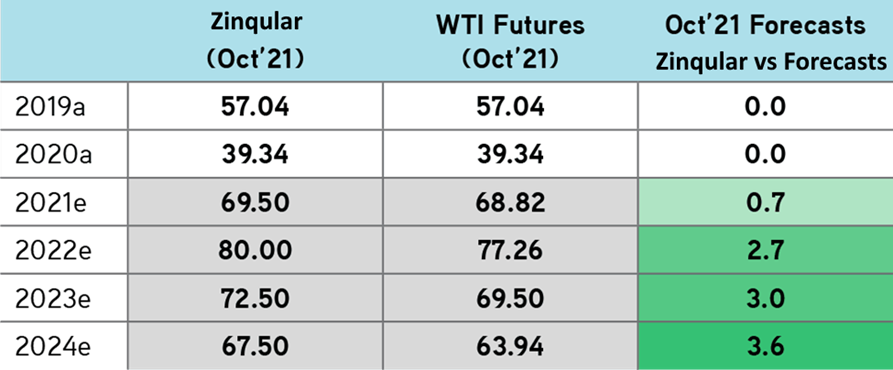
Forecasts represent full-year average price expectations. Data as at November 25, 2021. Source: Zinqular Insights & Research Hub analysis.
Valuation and S&P 500 EPS: Elevated in 2022
We began this essay by saying we remain positive on Global Equities in 2022. We view this asset class as interesting vehicle for thematic investors during a period of reflation and increasing unit volumes. We also think the dividend yield on Global Equities is still competitive enough with bonds to attract incremental flows from global asset allocators. So, while valuations and earnings are up materially compared to a year ago, our base case is that we are mid-cycle for Equities (refer to Exhibit 66). The exhibit also shows that mid-cycle returns are generally solid for investors, albeit they are less than early cycle ones.
Exhibit 65:
Our Zinqular Insights Regime Indicator Shows The U.S. Economy Is In The Mid-Cycle ‘Expansion’ Phase; In Spite Of COVID Cross-Currents

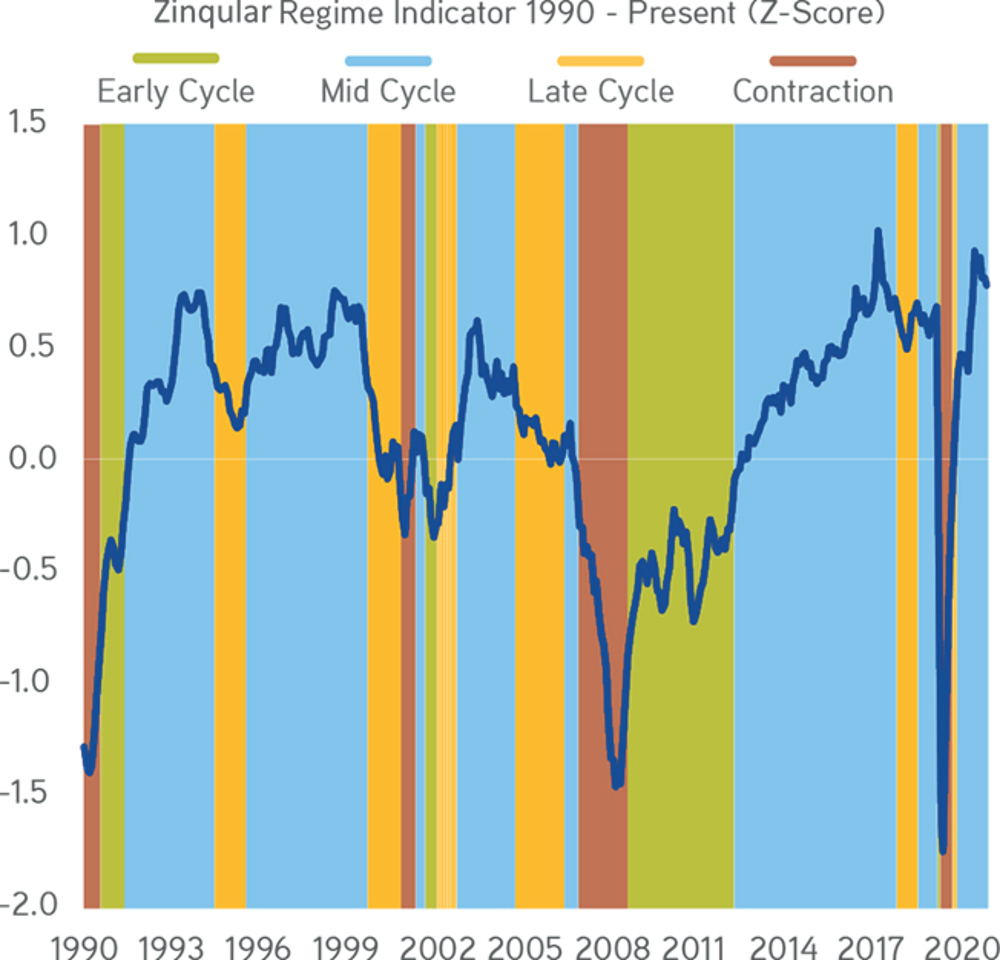
Our Zinqular Macro Regime Indicator is an equal-weighted average of ten components spanning macro, rates, corporate activity and the consumer that tries to quantify where we are in the cycle: (a) Early Cycle: indicator is below long-term trend, but the breadth of components is improving versus its trailing 6-month average; (b) Mid Cycle: indicator is above long-term trend and the breadth of components is improving versus its trailing 6-month average; (c) Late Cycle: indicator is above long-term trend, but the breadth of components is deteriorating versus its trailing 6-month average; and (d) Contraction: indicator is below long-term trend and the breadth of components is deteriorating versus its trailing 6-month average. Data as at December 15, 2021. Source: Census Bureau, BLS, BEA, ISM, NAHB, Conference Board, Haver Analytics.
Exhibit 66:
Returns Are Driven By Earnings Growth Than Multiple Expansion; Mid Cycle Is Inline With Above-Average Equity Market Performance Over The Next 12 Months.

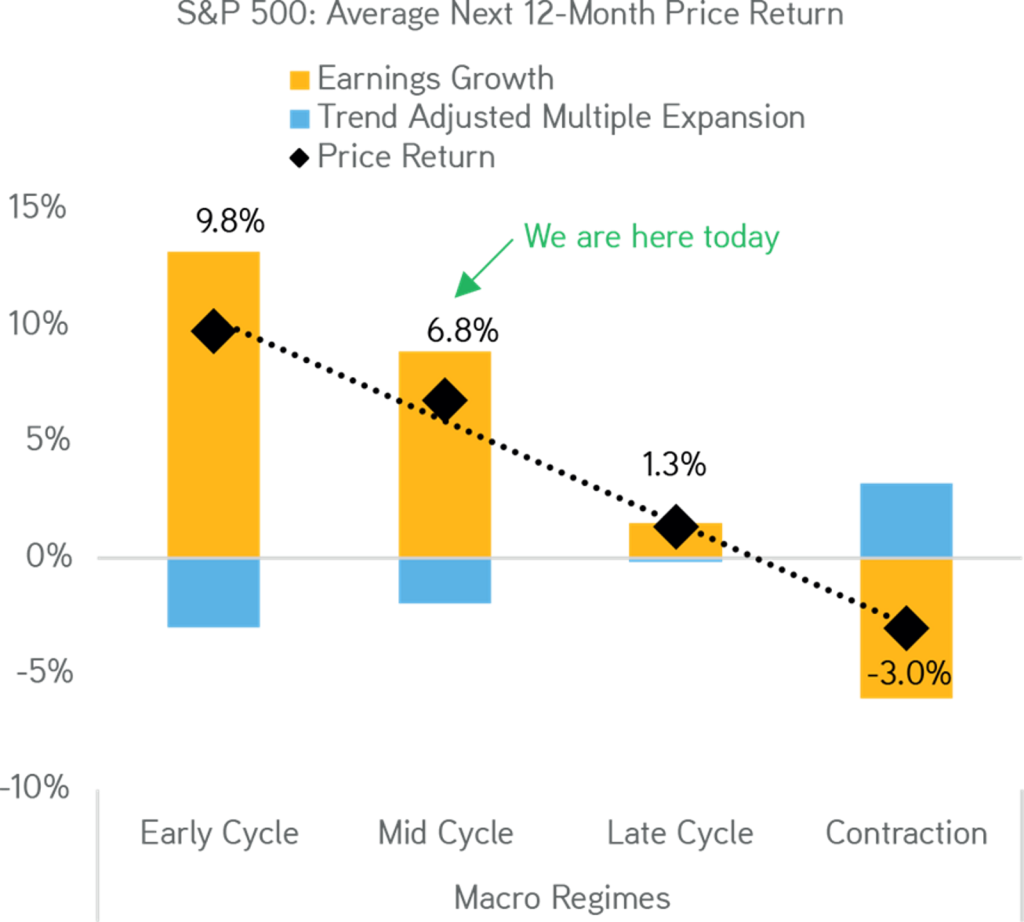
Data as at December 5, 2021. Source: Census Bureau, BLS, BEA, ISM, NAHB, Conference Board, Haver Analytics.
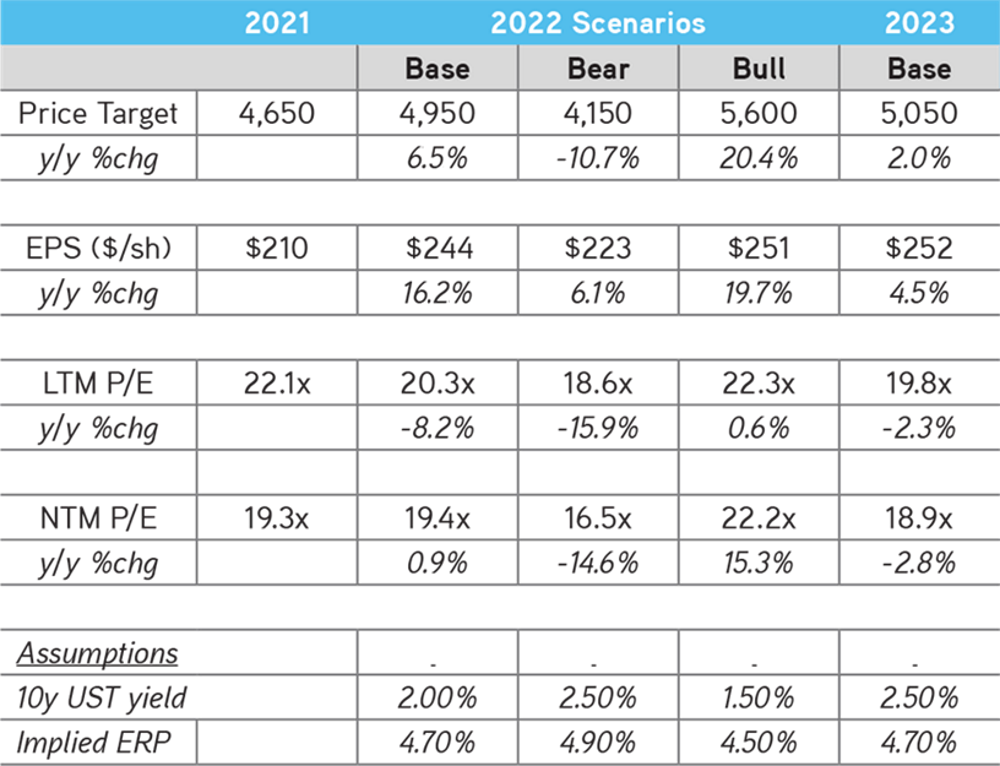
Regarding details for 2022, our base case is that (refer to Exhibits 67 & 68) the major share of returns at this point in the cycle will come from earnings growth – not form multiple expansion. Therefore, we expect solid earnings growth in 2022 (refer to details in Exhibit 67). We forecast EPS raise to $244+ in 2022 from $210 in 2021, almost a 16% raise. You may recall that we expected nominal GDP to raise over 9% in 2022, partially offset by 8.2% of multiple compression of 22.1x to 20.3x on the last 12 months (LTM) basis. So, upon this backdrop of higher earnings but a lower peak multiple, we expect equities to return 6.7% in 2022, including dividends.
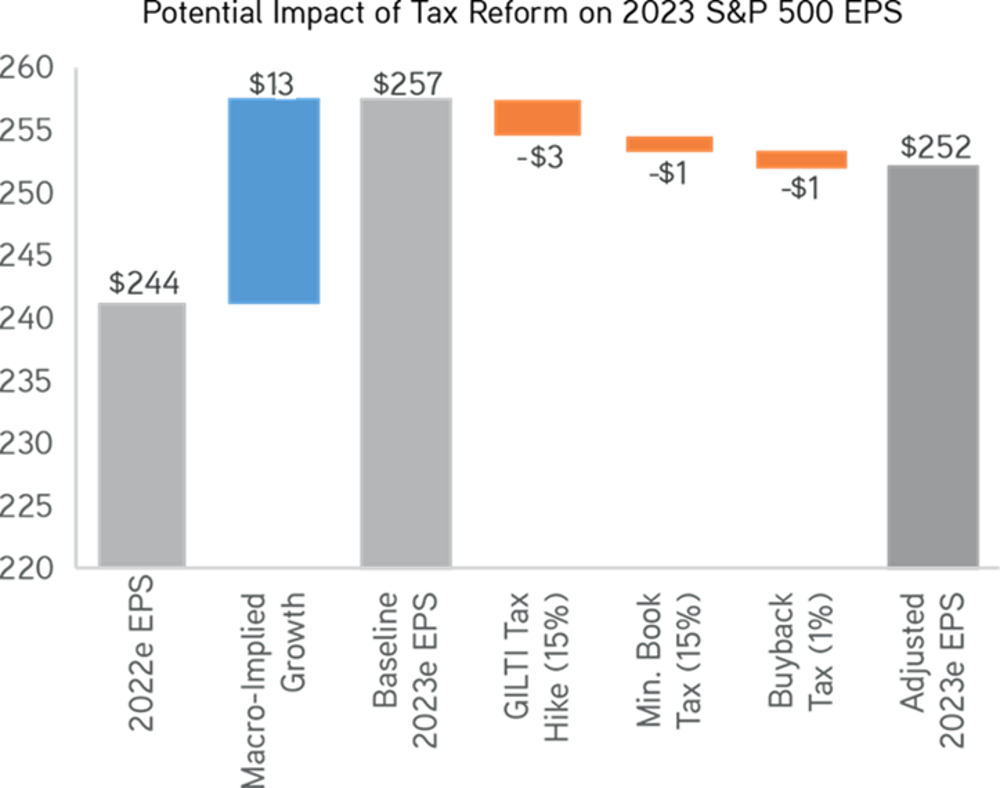
For 2023, both our earnings growth and multiple expansion expectations are much more conservative. As a result, our 2023 forecast is for total returns of just 3.4% based on earnings growth of 4.5% and an additional LTM multiple compression of 2.3% to 19.8x from 20.3x. Importantly, as we show in Exhibit 69, we also expect some tax headwinds to impact earnings in 2023. Specifically, S&P 500 EPS would take a 2.1% hit from the assumed implementation of a 15% minimum book tax, a 15% GILTI tax on foreign income, a one percent buyback tax and no change to the 21% corporate tax rate. Notably, the expected tax impact is more modest than our prior estimate of four to five percent when the corporate tax rate was slated to rise towards 25%.
Exhibit 67:
We Project S&P 500 Ending 2022 At About 4,950 On $244 Of EPS (More Bullish 1H2022 Than 2H2022) And Ending 2023 At About 5,050 On $252 Of EPS

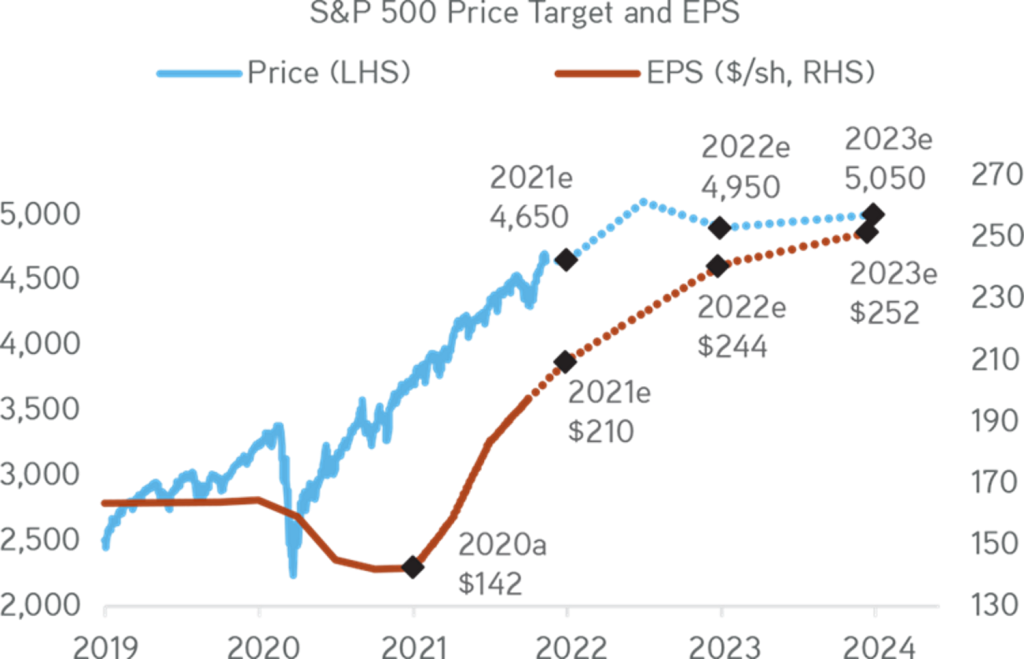
Data as at November 11, 2021. Source: Bloomberg, Factset, Zinqular Insights & Research Hub analysis.
Exhibit 68:
Our Case For 2022 Assumes That Equities Grind Higher In 2022, Driven By EPS Growth, Not Multiple Expansion

Data as at November 11, 2021. Source: Bloomberg, Factset, Zinqular Insights & Research Hub analysis.
Exhibit 69:
Massively Revised Infrastructure Plan Lowered Tax Bill to 15% Min. Book Tax, 15% GILTI Tax on Foreign Income & 1% Tax on Gross Buybacks; Means 2.1% Hit to EPS

Data as at November 16, 2021. Source: Bloomberg, Factset, Zinqular Insights & Research Hub analysis.
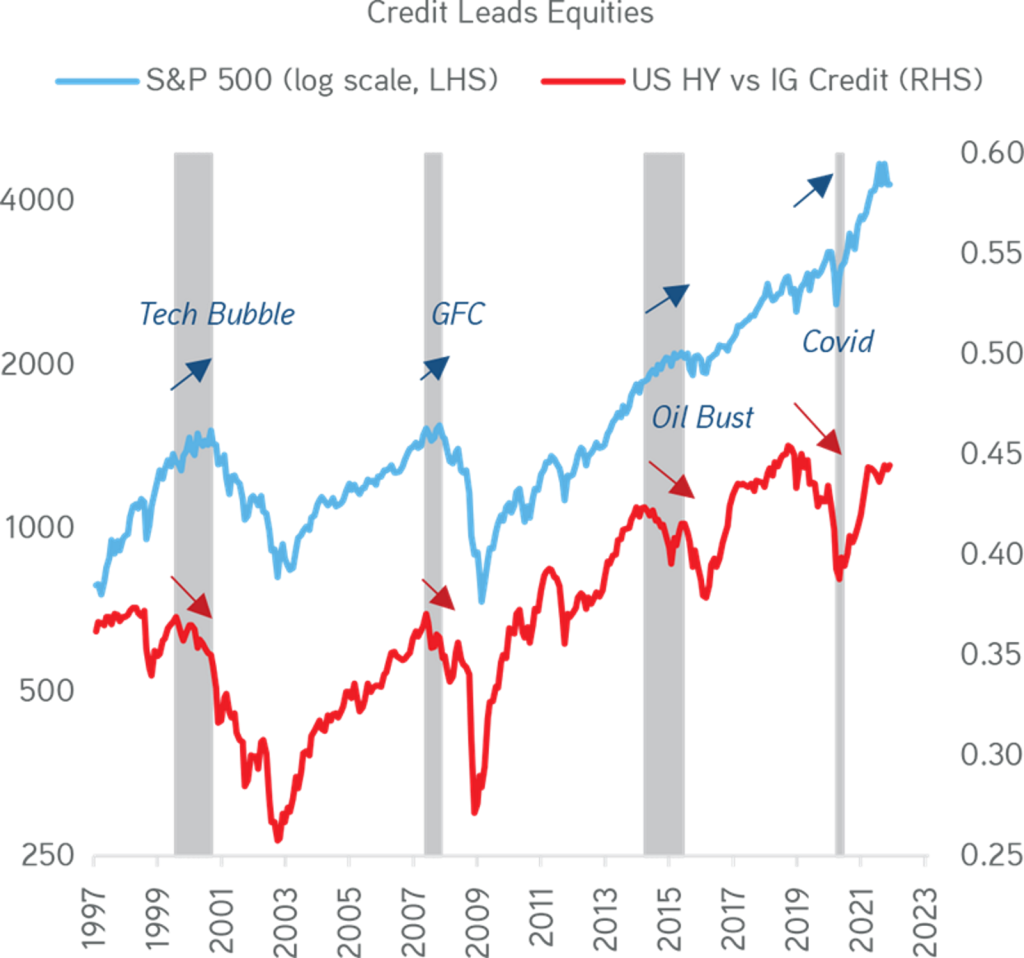
Exhibit 70:
Historically Credit Leads Equities into Bear Markets (e.g., COVID, GFC); No Credit Deterioration Thus Far

Data as at November 16, 2021. Source: Bloomberg, Zinqular Insights & Research Hub analysis.
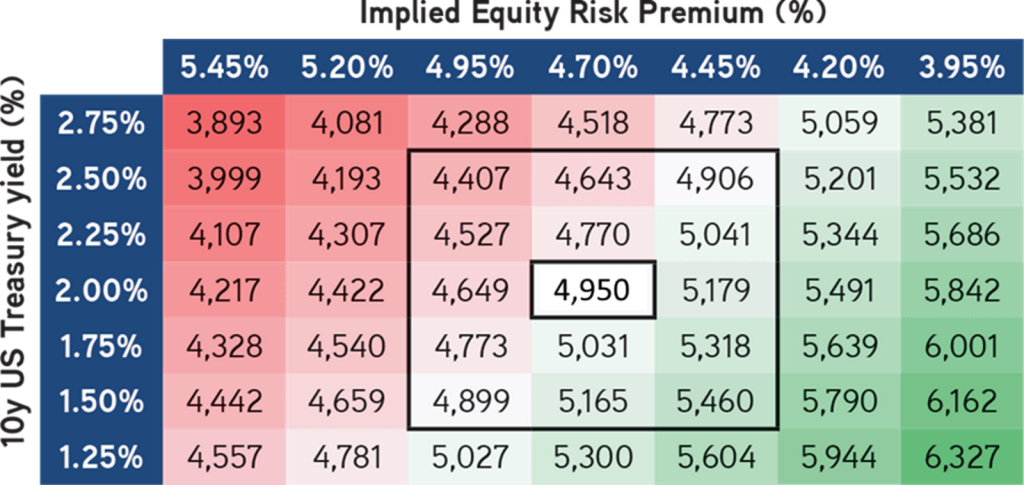
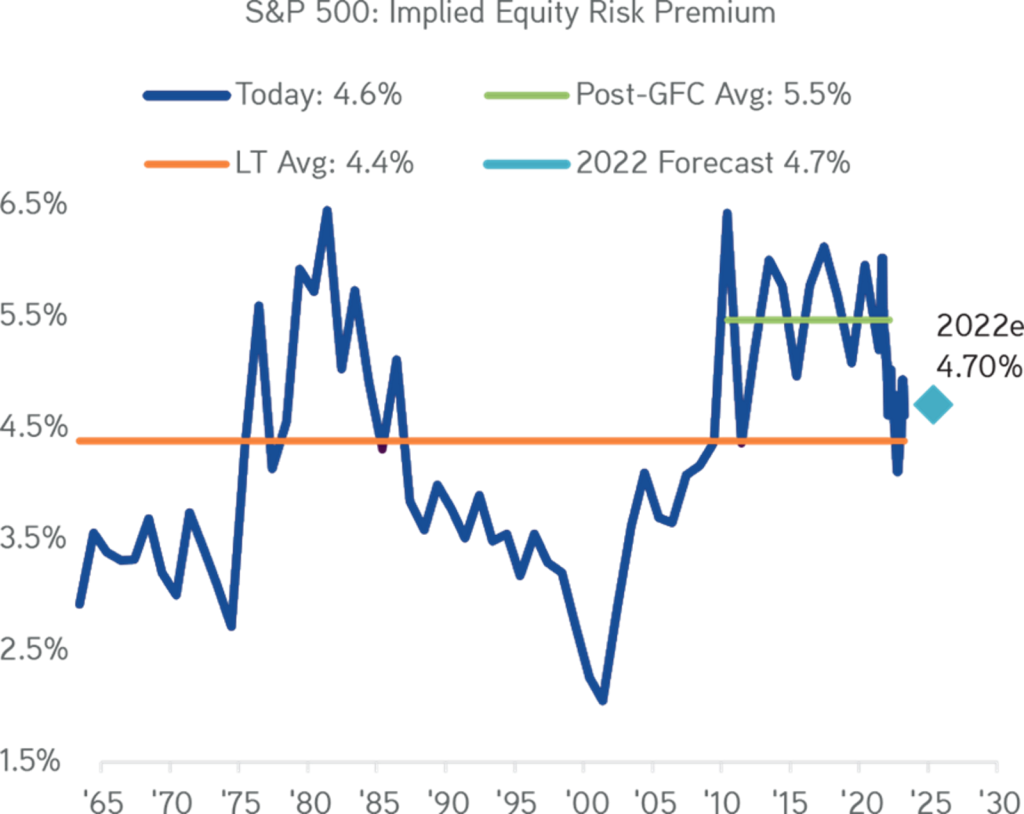
We will use (as we usually do) an equity risk premium (ERP) framework to inform our thoughts in this essay. The mix of unprecedented fiscal support, central bank liquidity, and strong economic growth has condensed the ERP to 4.6% today from a high of 6% during the beginning of the pandemic (Exhibit 72). As financial conditions remain accommodative relative to history, we expect higher real rates to coincide with decelerating economic growth, weaker earnings momentum and higher equity/rate volatility heading into the 3Q2022. As such, we use a higher ERP of 4.7% for 2022, which is 30 basis points above its long-term average. From an asset allocation perspective, we still believe that Equities remain an attractive inflation hedge amidst the more reflationary recovery that we are entering. But, as the economy matures, we do expect the current strong cyclical rally to make way to more muted returns in 2023.
Exhibit 71:
The Fair Value Est. For S&P 500 2022 Is 4,950, Which Means 6-7% Of Upside From Today’s Level, Including Dividends

Data as at November 11, 2021. Source: Bloomberg, Factset, Zinqular Insights & Research Hub analysis.
Exhibit 72:
Presuming ERP Moves Closer To 4.7% In 2022; 30 Bp Over Long-Term Average; As Macro Space Cannot Support The Margin

Data as at November 11, 2021. Source: Bloomberg, Factset, Zinqular Insights & Research Hub analysis.
Credit in Focus
Although we see upside to risk assets in 2022, we accept that most asset classes look expensive relative to history. Exhibit 73 shows that valuations are stretched except for one key metric: interest rates; interest rates are important. Nominal interest rates are low because central banks are encouraging buyers to move further out on the risk curve.
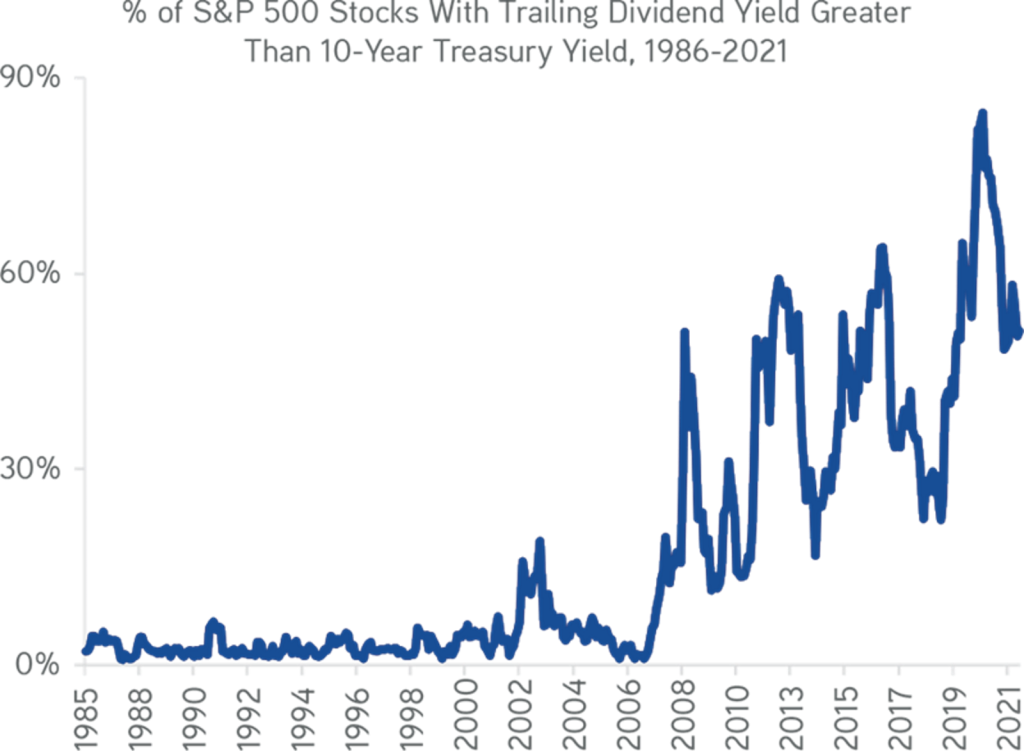
In spite of this, Equities look appealing relative to Credit. In Exhibit 75, which shows the earnings yield on stocks (i.e., the Earnings over the Price) looks compelling relative to the yield-to-worst in High Yield. Essentially, given the reflationary environment we are forecasting, we have strong conviction that Equities is a better value versus a fixed coupon credit instrument. But it is not just tight credit spreads that are skewing our model towards Equities. Rather, both the low absolute level of interest rates across all Fixed Income as well as the ongoing improvement in earnings for Equities are also impacting this relationship. Therefore, we see that the dividend yield on 50% of the S&P 500 companies is now above the level of the U.S. 10-year (refer to Exhibit 76).
Exhibit 73:
In The New Era, Investors Must Find Themes To Buy Down Entry Multiples And/Or Arbitrage Cash Flow Relative To Financing Costs

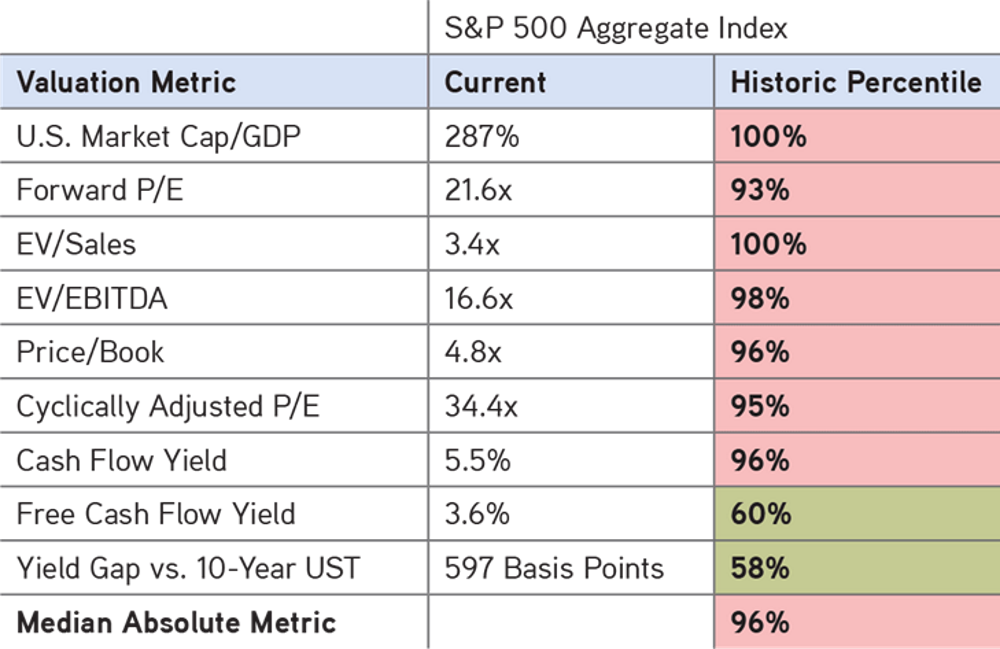
Data as at November 10, 2021. Source: Goldman Sachs Research.
Exhibit 74:
U.S. High Yield Default Monitor Is Now One Full Standard Deviation Below Long-Term Average

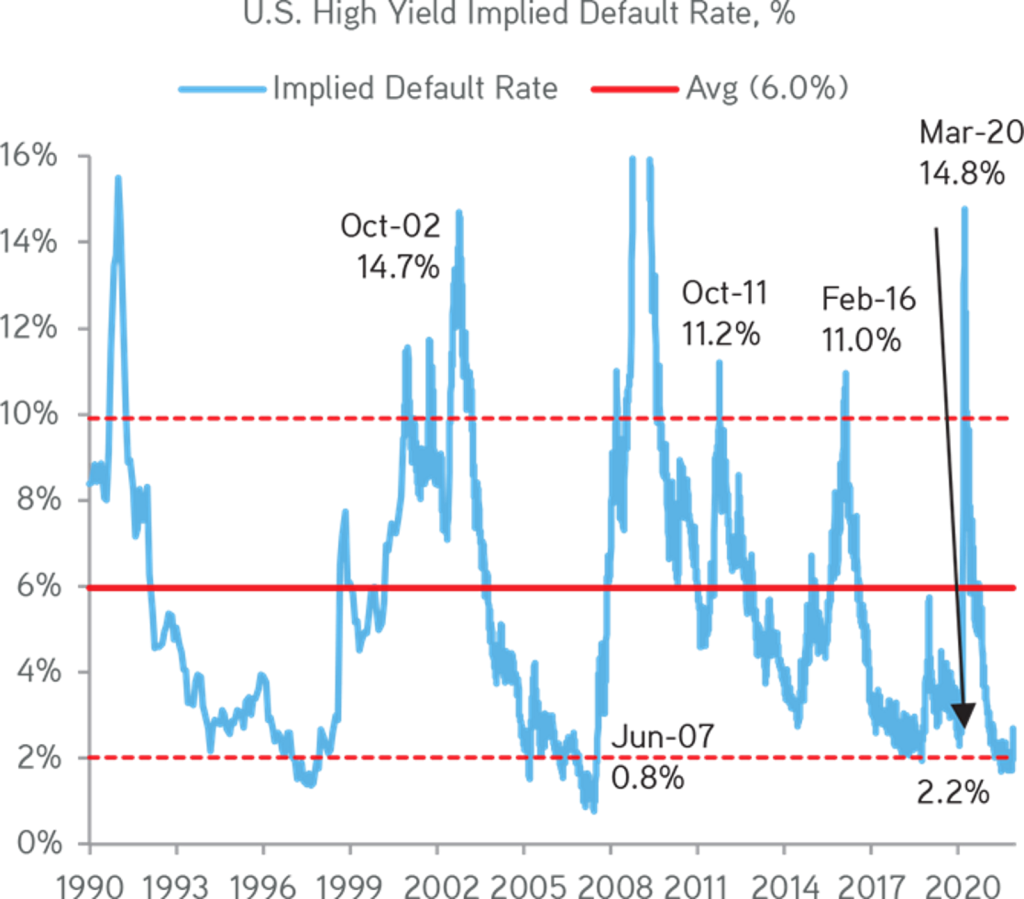
Data as at November 30, 2021. Source: Bloomberg, ICE-BofAML Bond Indices.
Exhibit 75:
U.S. Equities Are Appealing Than High Yield Credit By Huge Margin In 7 Years On A Relative Basis

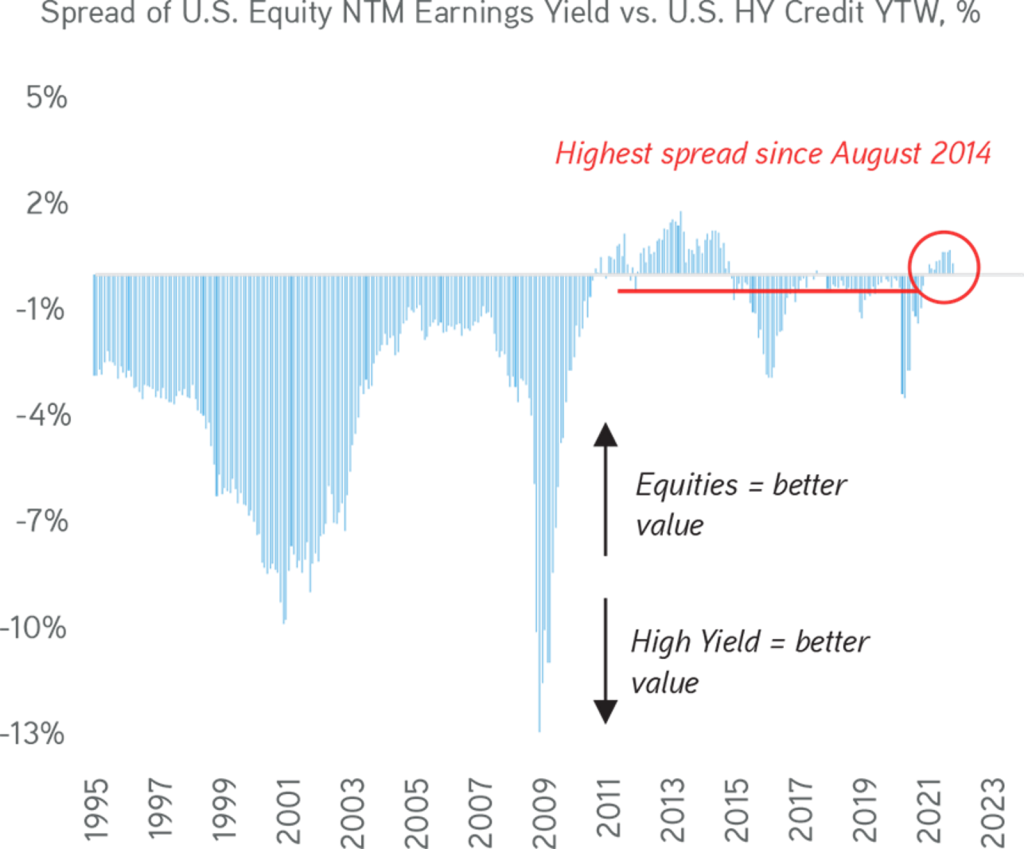
Data as at December 4, 2021. Source: Bloomberg, Zinqular Insights & Research Hub analysis.
Exhibit 76:
50% Of S&P 500 Firms Have A Higher Dividend Yield Than The 10-Year Yield

Data as at October 24, 2021. Source: Bloomberg, BofAML Global Research, Zinqular Insights & Research Hub analysis.
We remain agile in Credit; as we written in the introduction of this essay, we FAVOR owning Opportunistic Credit, which has the ability to sweep across High Yield, Loans and Structured Products. Some of the opportunities we are seeing in the larger end of the Private Credit market appeals to us. We are satisfied in both the value of the illiquidity premium in the current low rate environment as well as the shift in skew we are seeing towards larger, more stable companies with less volatility in their EBITDA direction.
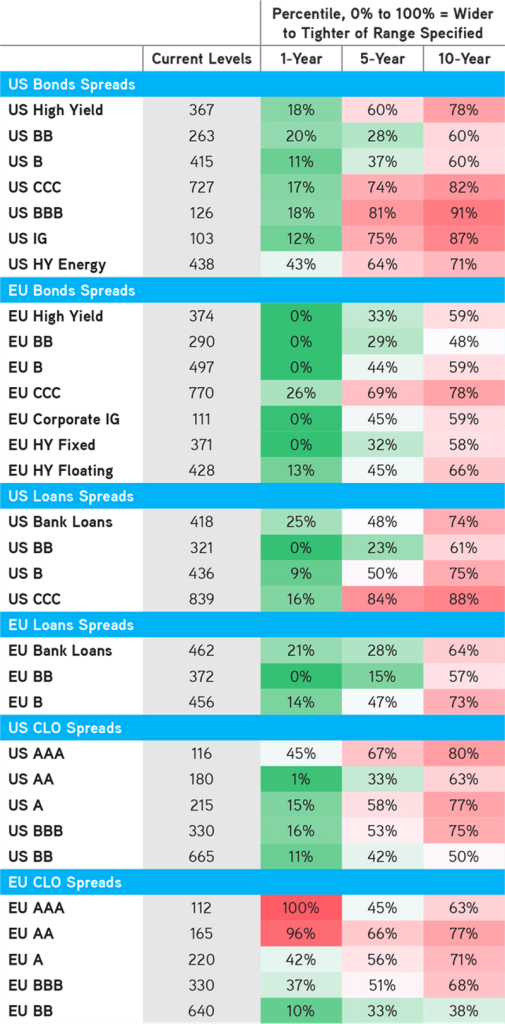
Generally, we still like floating rate over fixed rate in both private and public markets, although we accept that the recent volatility has made liquid High Yield – on the margin – more appealing in the short term. Concerning High Yield, we prefer single B and CCC given underweight duration positioning. CCC spreads in both the Europe and U.S. are at elevated levels in the past 12 months, with Europe trading wide to the U.S. on a spread basis for the first time in 10 years. Meanwhile, within the floating rate market, we favor Bank Loans and CLO BBs with spreads in the mid 600’s, which is wide to where they have traded in the past year. We have also seen strong demand and record issuance in this space. We think if concerns on rates continue, CLOs would naturally benefit. Meanwhile, Euro Loans, which are very CLO driven, also look attractive on a hedged yield basis.
Exhibit 77:
Interest In CLO Bbs, U.S. CCC’s, & EU Bund Spreads Due To Recent Volatility

Data as at December 4, 2021. Source: Zinqular Portfolio Construction analysis.