

Authors: Barry Simon Graham (Co-CIO) and Michael Yaw Appiah (Co-CIO)
[wpfd_single_file id=”1979″ catid=”327″ name=”Global Investment & Economic Outlook 2022″]
For the past 20 months, we experienced something terrible and far-reaching – a pandemic that has engulfed the entire world and altered it permanently. It impacts had a horrific human toll and transformed the way society lives.
The reverberation of the pandemic has been highly uneven. It triggered the most severe global economic contraction since the 1930 Great Depression and the sharpest fall off in equity markets since 1987. And although the stock market recovery augur well for growth as the pandemic abates, the current situation remains one of economic recovery.
In addition, the pandemic also accelerated deeper trends, from the growing retirement crisis to systemic inequalities. Far from the human tragedy, there are also important market contemplation that, we as fiduciaries, we are required to consider. How will the stimulus filter through the economy, what parts of the economy will recover, what areas will continue to face more structural headwinds, and ultimately, what ways are the best for deploying capital in an uncertain time and in the new era ahead?
As a firm, we have been able to navigate the pandemic from a position of strength. We had strength from our differentiated investment platforms, including sourcing and our ability to transact up and down capital structures, across both geography and sector.
Last but not the least, we operate from a position of strength because of our excellent in-house team of professionals who worked with great effort to guide our portfolio companies throughout the pandemic as well as the expertise and guidance from our infectious disease specialist and chief medical advisor.
We think there are lots of new opportunities in the next cycles although the current investing environment is quite overpriced than it was pre-COVID and potential geopolitical and macro crosscurrents and headwinds must not be ignored. Essentially, the current cycle will be quite different from the previous. We would review six areas of difference and opportunity relative to the 2009 to 2019 recovery (i.e., GFC & Oil bust recoveries).
Enormous Opportunities in Energy Transition
Firstly, the enormous opportunities in energy transition. The momentum is huge, moving very quickly, and is yielding some key, unintended consequences. How big is it? Based on available statistics, we estimate that countries accounting for over 70% of world GDP and greenhouse gases now have formalized targets for net-zero emissions, typically by 2050 – 2060. While estimates vary substantially, our data at Zinqular indicates that the energy transition space is an approximately $1.5–$2.0 trillion per year growth opportunity. Refer to our themes section for full details but we believe that this type of growth opportunity suggests almost all aspects of sustainability, resiliency and environmental services could be winners. Amazingly, though, the push for a cleaner environment may actually create more reflationary trends and exacerbate inequality in the near-term.
Exhibit 78:
We Are At A Massive Inflection Point In The Regulatory Environment Relating To Climate Change

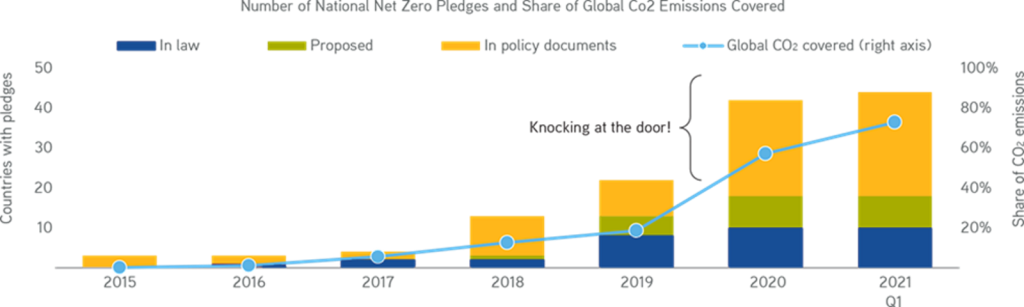
Data as at October 30, 2021. Source: International Energy Agency (2021), Net Zero by 2050, IEA, Paris: Net Zero by 2050 Scenario – Data product – IEA. License: Creative Commons Attribution CC BY-NC-SA 3.0 IGO modified by Zinqular, BloombergNEF, Bloomberg Terminal, Nexant ChemSystems, Tecnon OrbiChem.
Ultra Easy Monetary Policy
Secondly, monetary policy has been much bigger and more front-ended. Unlike the fallout of the Global Financial Crisis (GFC), there have been “zero” desire austerity post pandemic. The average inflation targeting program launched by the Fed will certainly be the biggest shift in U.S. monetary policy since the introduction of quantitative easing at the end of the GFC and should hold rates much lower than would have been considered historically. This policy shift will allow inflation to run above the target of two percent for some time before interest rates hikes. This will also propel CIOs to buy “multiplicity” and sell “simplicity”, as they are compelled to be more considerate in the use of illiquidity to capture higher returns. Previously, we have asserted that corporate carve-outs are amongst the most attractive ways to uncover devalued and underappreciated companies in bifurcated markets — markets that seem to eschew multiplicity in favor of simplicity at almost all costs. We still think the opportunity to acquire high quality carve-outs across PE, Infrastructure, and Energy remains enormous.
Exhibit 79:
Availability Of Huge Amount Of Stimulus In The Economy Despite Tapering

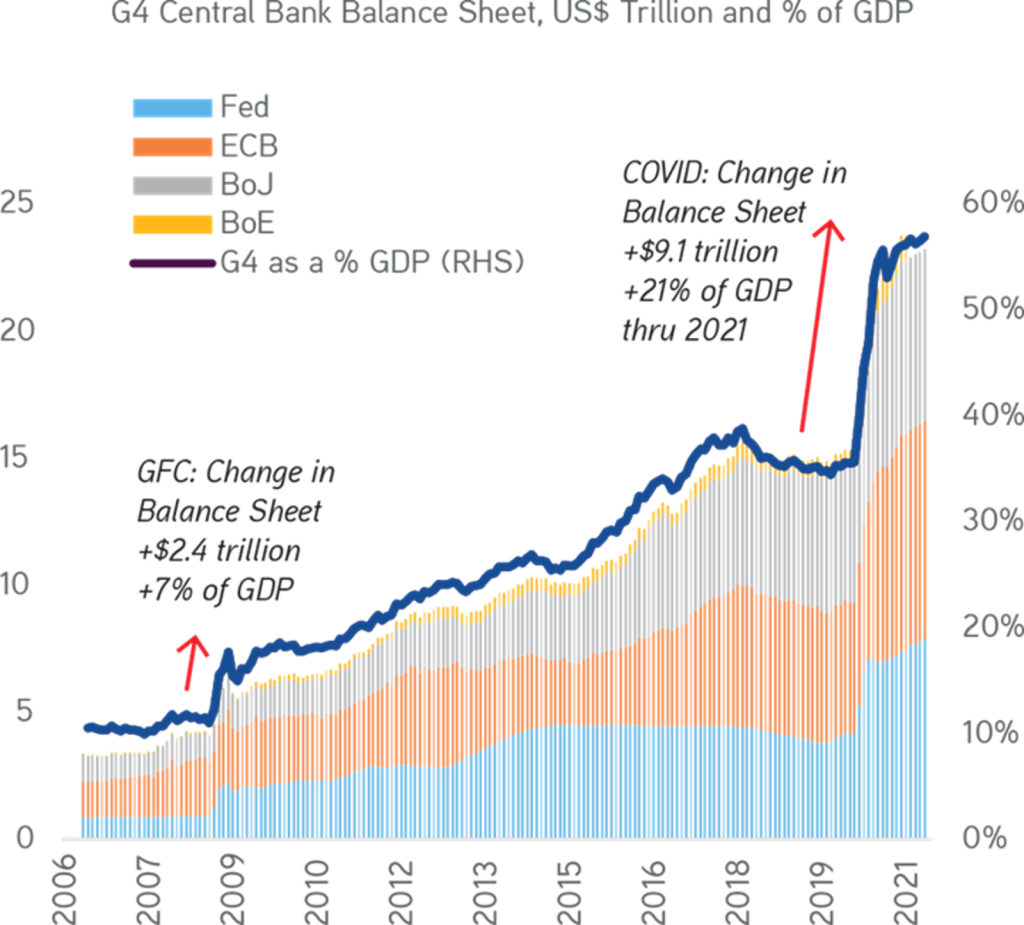
Data as at October 26, 2021. Source: Zinqular Insights & Research Hub analysis.
Exhibit 80:
There is Structural Move to More Permanent Support of Consumer Outlays in the US

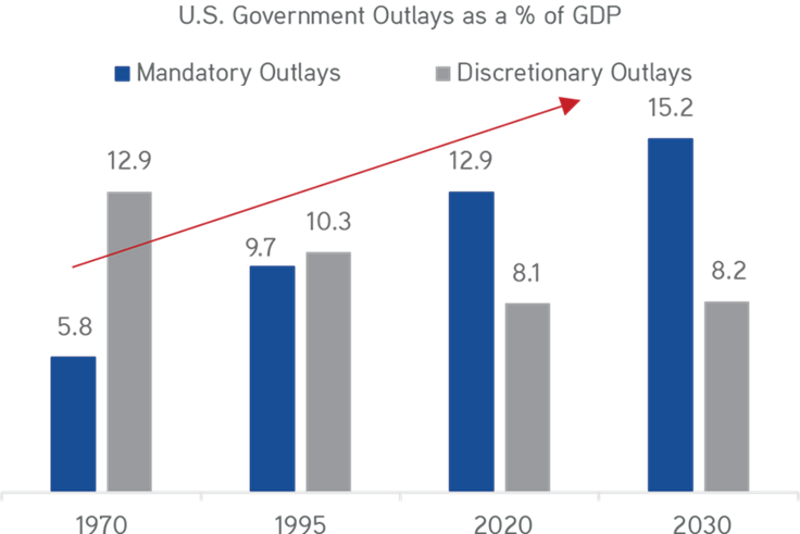
Data as at October 31, 2021. Source: Congressional Budget Office.
Thirdly, the global fiscal response to the pandemic has been almost three times more than the support provided during the GFC. It is a different type of stimulus provided; its intensity and scope was global as global central banks have responded forcefully. There has also been considerably less bank de-leveraging. We believe that the intensity of this response will continue to support our thesis that this recovery will be much more robust relative to the prior recovery in 2009.
Exhibit 81:
Record Stimulus & Surging Demand is Driving High Electricity Prices When Demand Outstrips Supply

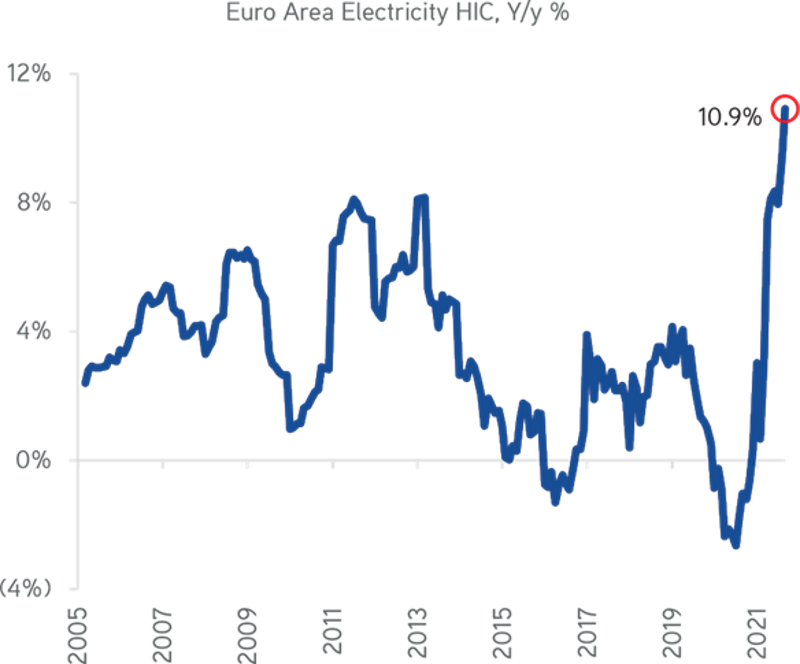
Data as at November 10, 2021. Source: European Communities, Bloomberg.
Exhibit 82:
Most Businesses Are Worried About Labor Issues

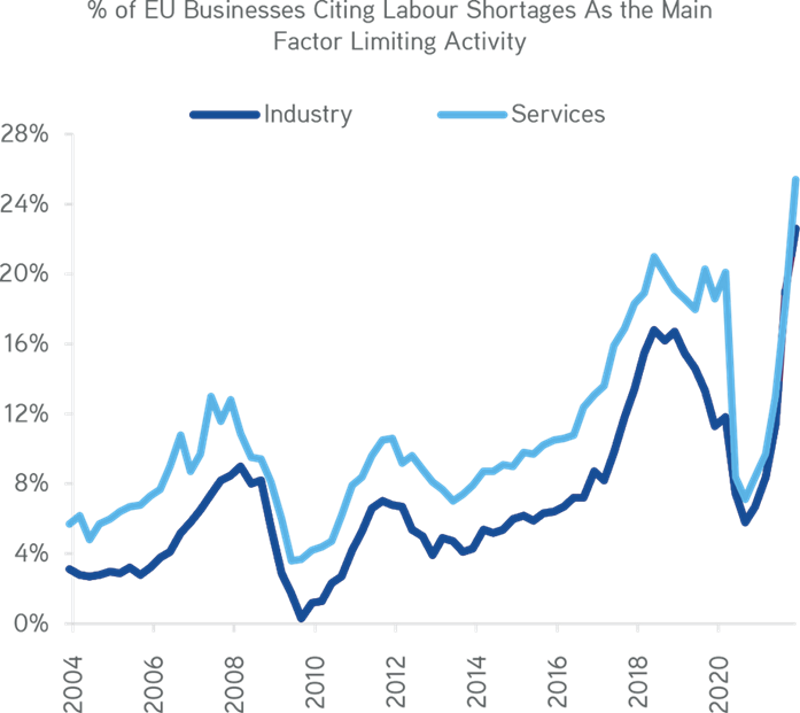
Data as at October 31, 2021. Source: European Communities, Bloomberg.
Fourthly, the enormous stimulus in the economy is an impetus to a world where input costs, including wages and select commodity prices, are increasing at a faster pace than consumer prices. Although we expect many of the commodity prices to stabilize and partially retreat from record levels, we do think they will remain up-bid and volatile. For that reason, this part of the macroeconomic landscape is not ‘transitory’, and as such, it likely means that innovations and general-purpose technologies becomes a mandatory requirement for success to control ongoing margin pressure. In our humble opinion, we think almost all things digital, cloud-native, AI will do well, as will vast the online security industry. Digital business-to-business (B2B), business-to-business-to-consumer (B2B2C) & applications, including Insuretech, Regtech, Fintech, Healthcare, also are likely to thrive. On the consumer; side business-to-consumer (B2C) and consumer-to-consumer (C2C), the shift online in key industries such as healthcare, retail, and business services will be accelerated by 5 to 7 years. Generally, though, we think that all industries could positively be impacted, including consumer, logistics, manufacturing, and financial services.
Fifth, is real interest rates. Although, we expect some tightening of financial conditions in 2022, we think real interest rates will be lower for longer this cycle, which we think further increases the value of the illiquidity premium generated by private investments. This makes us to be bullish on assets linked to nominal GDP growth with upfront cash flows. Therefore, we have more overweight position on our balance sheet asset allocation to Asset-Based Finance in Infrastructure and parts of Real Estate and Credit. On top of the upfront yield, the ability of these investments’ collateral to appreciate alongside – or potentially even faster than – nominal GDP is very attractive.
In summary, there is incredible excess savings, which we believe will propel strong consumer demand in the near term. This was definitely not the case in the 2009 recovery. For instance, the U.S. consumer savings rates peaked at just 7.9% post-GFC, compared to a record 33.8% post-COVID. Our internal data suggest almost 17% of personal consumption expenditures, or $2.5 trillion, has been put aside to help drive consumption during the coming quarters and cycles. In addition, with unemployment levels declining and real wages increasing, we believe consumers will start spending some of this dry powder, even if inflation pressures do remain elevated. Indeed, even in a five to six percent inflationary environment, we have yet to see consumers dipping in their savings to make discretionary purchases.
So, pulling all of this together, what does this backdrop mean for investing? We think there are several key themes to invest behind and they are as follows:
Overweight Firms /w High Pricing Powers
Pricing Power: We are overweight Price Makers (i.e., Buy Price Makers). Our steadfast view is that firms that leverage their competitive advantages, including technological prowess and speed to market to raise their prices and keep pace with soaring input costs will do very well in the next few quarters and cycles. Price makers often can reprice their goods and services quickly, or they offer critical components of relatively small cost compared to the overall price of the finished product.
In principle, ‘price maker’ firms will not be subject to monopsony-type dynamics with just a few powerful buyers and many undifferentiated sellers. They generally can pass through cost increases via frequent contract repricings or inflation-linked pricing on long-term contracts. They also are not subject to economically insensitive pricing dynamics that can inhibit the ability to maintain margins in a rising cost environment.
Real assets should do particularly well in a reflationary, pricing power-driven economy. Investments tied to collateral-based cash flows in key sectors such as Real Estate, Infrastructure and Asset-Based Finance can deliver pricing power in the macroeconomic backdrop we envision. The value of today’s existing collateral, particularly if it is cash flowing, will rise because it is more expensive to replace in a reflationary environment.
At the same time, with ESG and specifically climate change initiatives accelerating, beneficiaries over the long term could include early movers on low‐carbon technology development in building materials. They likely will be in better cost positions when economics change with carbon pricing. Therefore, with so much focus globally on shifting to clean energy, the transition to net zero could boost inflation. R&D cost of new technologies is quite high, and policies to encourage the transition may hike supply chain prices as emission and tariff policies add to production costs.
Exhibit 83:
Currently EPS Revisions Means Sales & Cost Management Is A Major Factor Driving Stocks; Quantitative Reality Supports Our Pricing Power Thesis

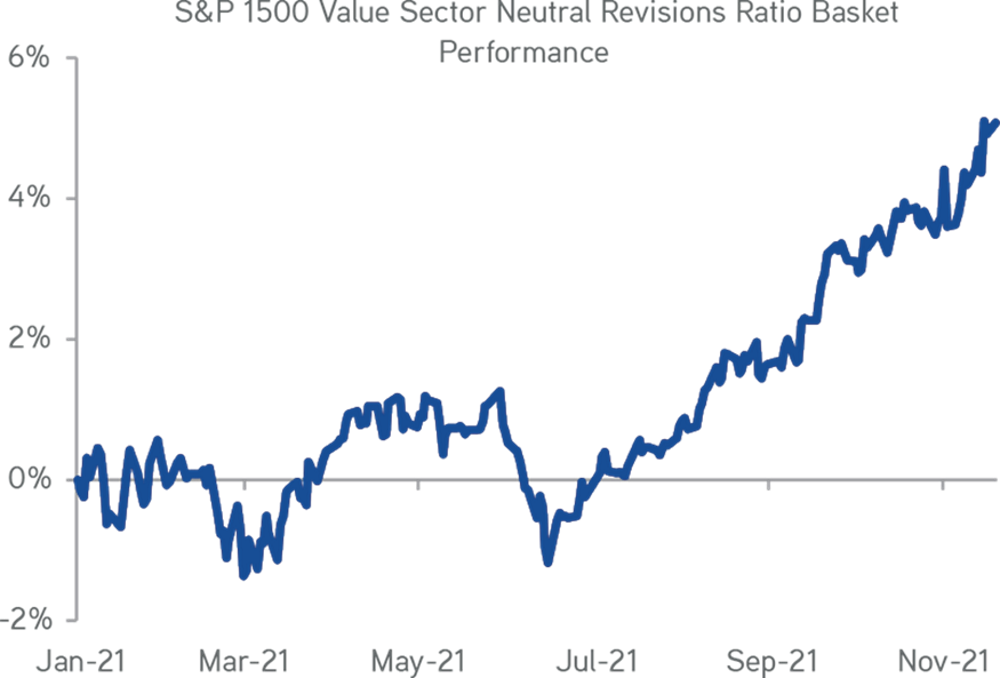
Data as at November 24, 2021. Source: Cornerstone Macro.
In contrast, thematic investors should be wary of price takers. The present environment likely will lead to multiple and earnings declines for firms that have high leverage levels and the inability to pass through costs, including labor. Consumer product companies with unhedged input costs are likely to suffer, as could others with large lower‐wage workforces and limited pricing power, such as retailers and health care services. Investors should also be wary of firms that could have trouble passing on higher input costs to a small and powerful base of buyers, including the government services and auto parts arenas.
Exhibit 84:
Reviewing 40 Years Of Data, We Find Real Yields On 2-Year Notes At Extreme Levels. We Respond Using More Cash Flowing Assets With Pricing Power & Collateral Support

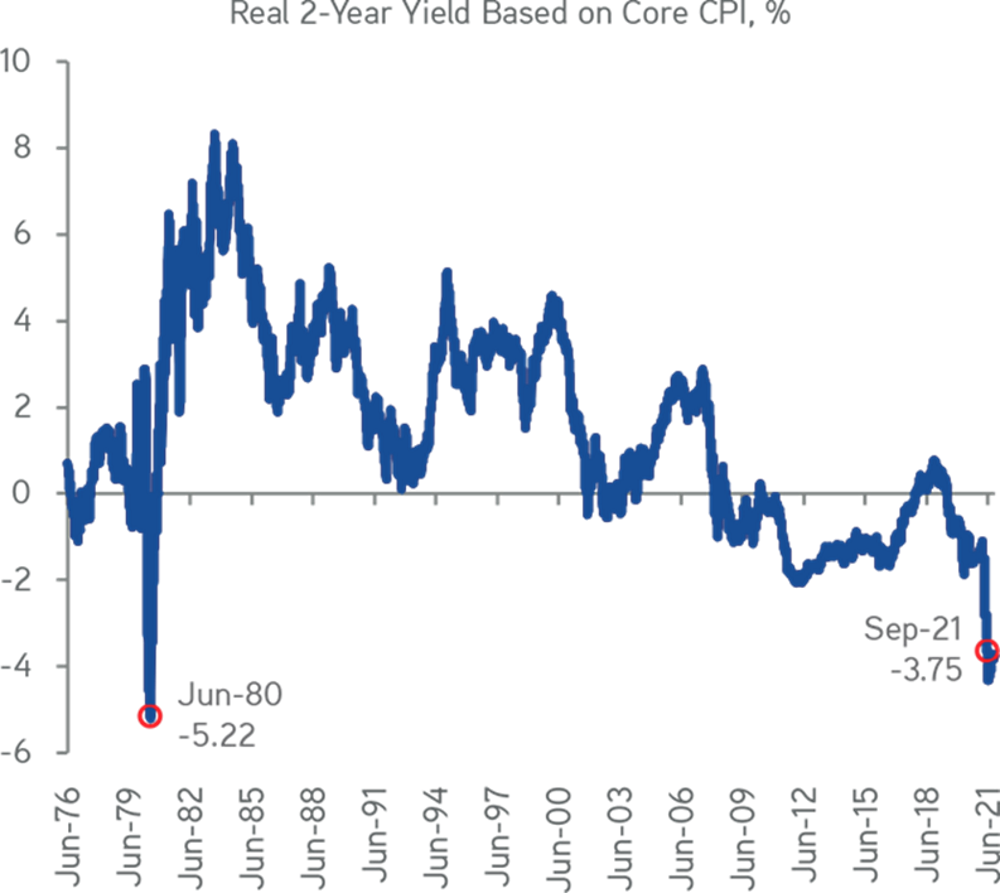
Data as at July 31, 2021. Source: Bureau of Labor Statistics, Haver Analytics, Zinqular Insights & Research Hub analysis.
Exhibit 85:
The Reflation Strategy Is Based On Holding Nominal Interest Rates Below Nominal GDP

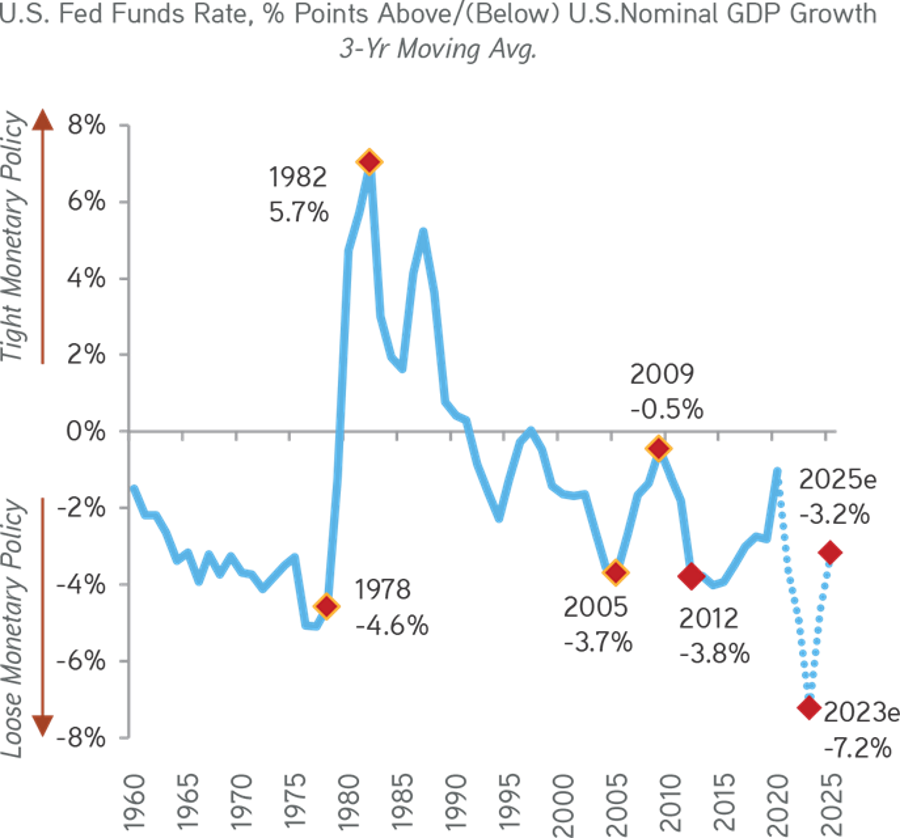
Data as at October 30, 2021.Source: BEA, Federal Reserve, Haver Analytics.
Buy Collateral-Based Cash Flows
Desire for Yield: In our view, the demand for collateral-based cash flows, including Infrastructure, Real Estate, and Asset Based Finance, is on the verge of accelerating more than many investors now believe. We have entered a unique period where global central bankers, especially those in the United States, are doing their best to ignite some inflation to accelerate growth in nominal GDP by holding interest rates at record low levels. Central bankers intent on generating sufficient growth to benefit historically marginalized populations, including commitment to narrow the employment and growth gaps between White, Hispanic and Black Americans. It is also an attempt to lower debt levels relative to GDP by encouraging nominal growth of the economy that is far in excess of the level of interest rates (refer to Exhibit 85).
Exhibit 86:
Global Negative Yielding Bonds Remains High

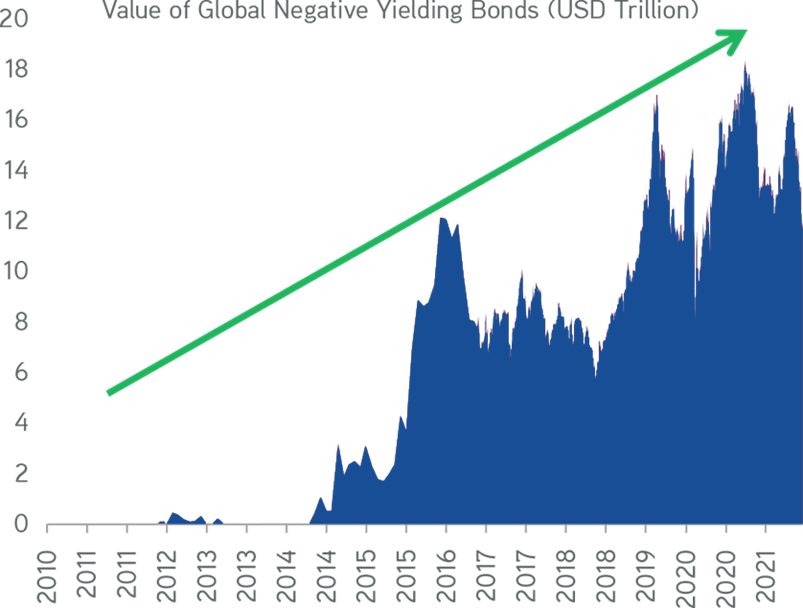
Data as at November 11, 2021. Source: Bloomberg Barclays Aggregate Negative Yielding Debt Index.
Exhibit 87:
Real Assets with Yield & Inflation Protection is Interesting to us; Though Bond Yields are Close to Decade Lows

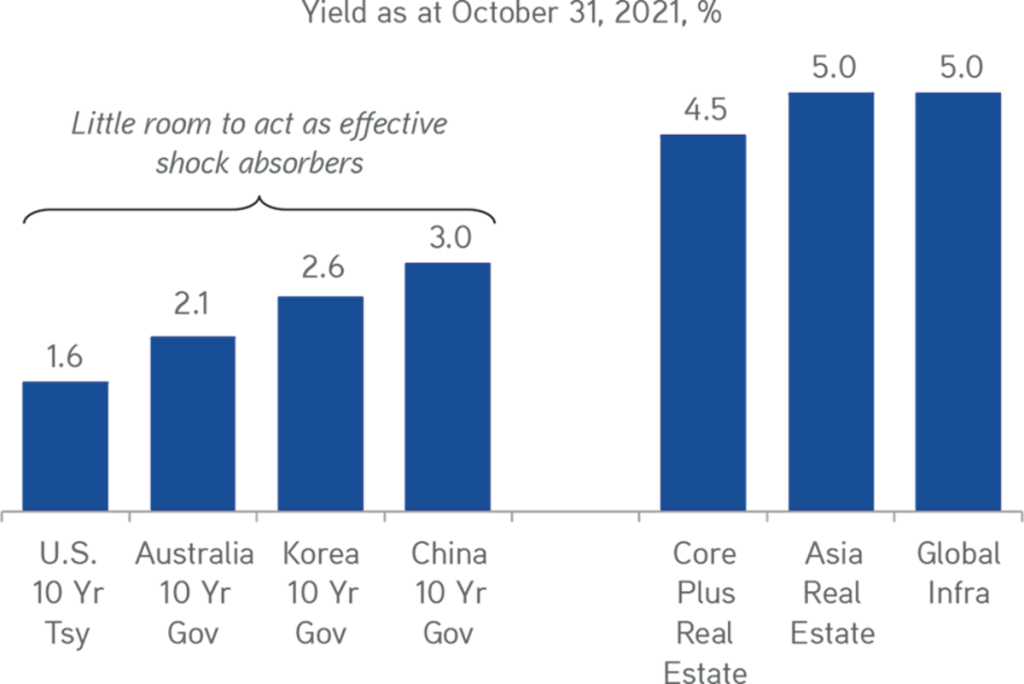
Data as at November 28, 2021. Source: Bloomberg, Zinqular estimates.
One may ask why do we think reflation will occur and how different will this be time – as we are getting a V-shaped recovery amidst an L-shaped response by the Federal Reserve and European Central Bank. Consequently, fiscal stimulus has been front-loaded. At the start of the 2009 recovery, both fiscal and monetary stimulus started small, and rollout late. Remember that the Fed’s current forecasts have inflation ahead of its target for four consecutive years.
It is upon this setting that we prefer to own collateral that can consistently distribute a recurring cash flow stream and can raise prices enough to offset rising input costs. In conclusion, looking forward, we have high conviction that ― driven by a structural yearn for yield ― we are still in the early innings of a structural upward re-rating in collateral-based assets that can generate a competitive upfront yield without too much leverage.
Multiplicity Vs. Simplicity
An important investment theme in a market that is propelled by outsized central bank liquidity is to buy multiplicity and sell simplicity. The reality is that the shift in the Fed’s policy to average inflation targeting as well as similar programs developed by central banks around the globe have forced many CIOs to be more mindful in the use of illiquidity to attract higher returns. Over the years, we have argued that corporate carve-outs are amongst the most appealing ways to find devalued and underappreciated companies in bifurcated markets — markets that seem to eschew multiplicity in favor of simplicity at almost all costs. We still believe that the opportunity set to acquire high quality carve-outs across PE, Infrastructure, and Energy remains outsized. For instance, we see many ongoing ‘last mile’ financings in key markets like Infrastructure and Real Estate where core buyers are not willing to deploy capital until a project is fully developed. Therefore, for investors who have some appetite to take small development and financing risks, there is the potential to earn outsized returns relative to when the narrative becomes more simplified in the public markets. Within our Credit Opportunities franchise, we see unique capital solutions, including convertibles and preferred securities that offer above average returns because they do not fit nicely within the asset allocation of a traditional pension and/or endowment.
Excess Savings Bull Market
Our view is that the current macroeconomic settings is creating a savings bull market. Several important forces need to be considered to make savings an extremely compelling investment theme to pursue. Firstly, while there are economic benefits to quantitative easing in the form of easier financial conditions, it does have the long-term effect of unduly negatively affecting current retirees by reducing interest rates to levels below where they otherwise would be. Said another way, for an insurance company that represents millions of individual savers, not only are they earning less on their current investments, but the value of their liability stream is also increased.
Secondly, because of the QE and the increase in disposable income, the savings rate has increased meaningfully since the pandemic, despite interest rates having fallen further. In fact, we now estimate that U.S. consumers will have banked about $2.5 trillion in extra savings by year-end, equivalent to fully 17% of pre-pandemic annual consumption spending. In Europe, our internal data suggest excess savings by Eurozone households in 2020 alone reached close to half a trillion euros, about 75% of which reflected the restricted ability to consume during the pandemic, with the remainder mostly reflecting increased precautionary saving. At the same time, we think, believes that the number is close to RMB 6.2 trillion, equivalent to 18.2% of pre-pandemic annual retail sales in China.
Thirdly, due to record direct government assistance this cycle, U.S. consumers have saved, paid down debt, and improved their cost of capital on what debt remains. In fact, this was the only downturn in which disposable income actually went up in a deep recession, and a lot of that has been saved.
Exhibit 88:
Pandemic-Era ‘Excess Savings’ Set to Peak $2.5+ Trillion, or Fully 17% of Annual Consumption Spending

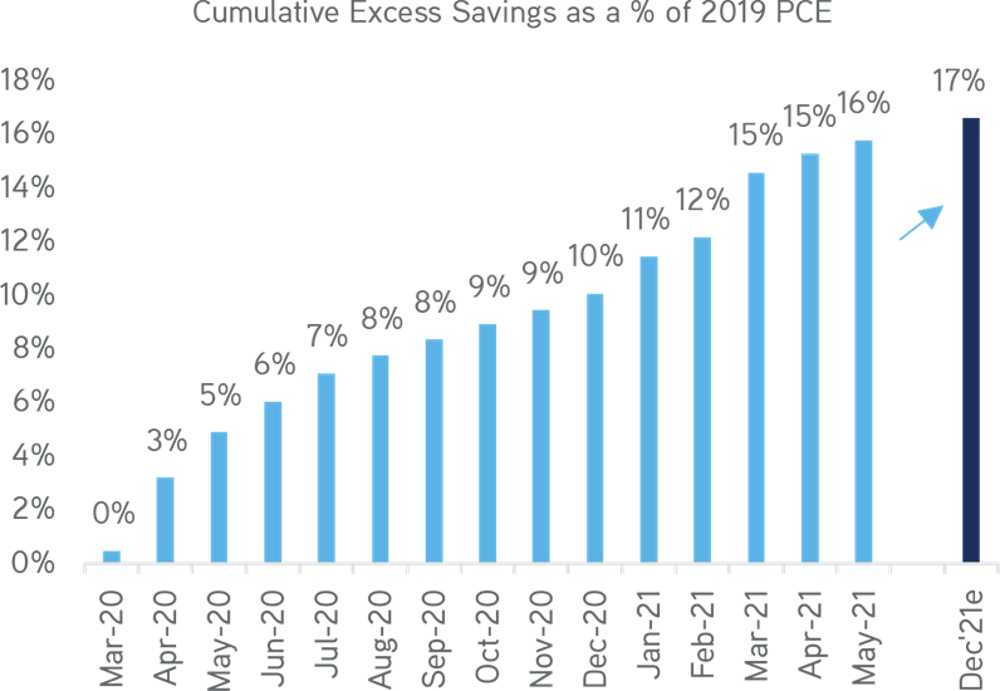
Excess Savings = Savings in excess of 7.7% run-rate savings rate (based on the 2018-19 average). Data as at July 30, 2021. Source: Bureau of Economic Analysis, Zinqular Insights & Research Hub analysis.
Exhibit 89:
Plus, Unspent State & Local Stimulus Funds Is A Further $400 Billion; Or About 1.8% Of GDP

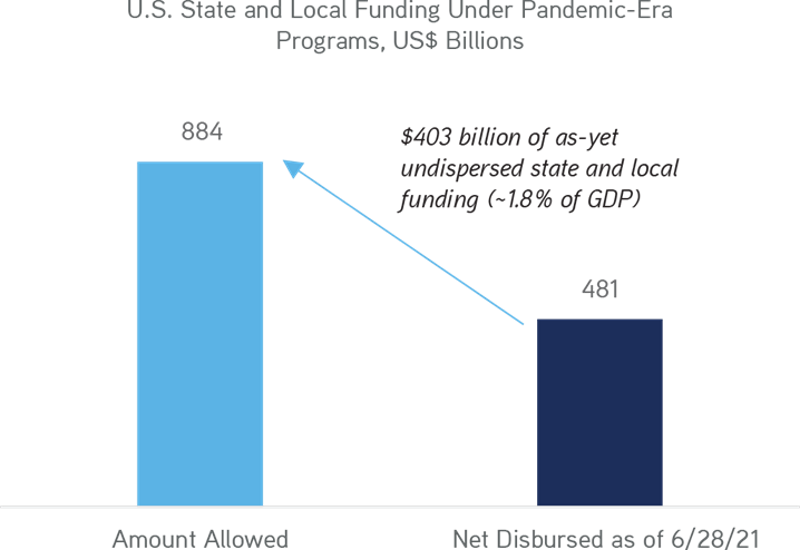
Data as at July 25, 2021. Source: Covidmoneytracker.org
Wealth Transfer Between Generations
Fourthly, due to fast paced innovation and consolidation, there is a huge amount of corporate and investment related wealth that will eventually need to be transitioned (refer to Exhibit 90). Referencing the 2019 wealth transfer report, by Cerulli Associates estimated that 45 million households will transfer as much as $68 trillion between generations within 25 years. Nearly 60% of that wealth transfer will benefit Generation X and millennial households. Focusing on millennials alone, Cerulli estimates that as baby boomers die between 2036 and 2040, millennials could inherit up to $22 trillion by 2042.
Exhibit 90:
In 2Q2021, Americans Aged 70+ Had A Net Worth Of Nearly $35 Trillion; Equaled 27% of all U.S. Wealth…

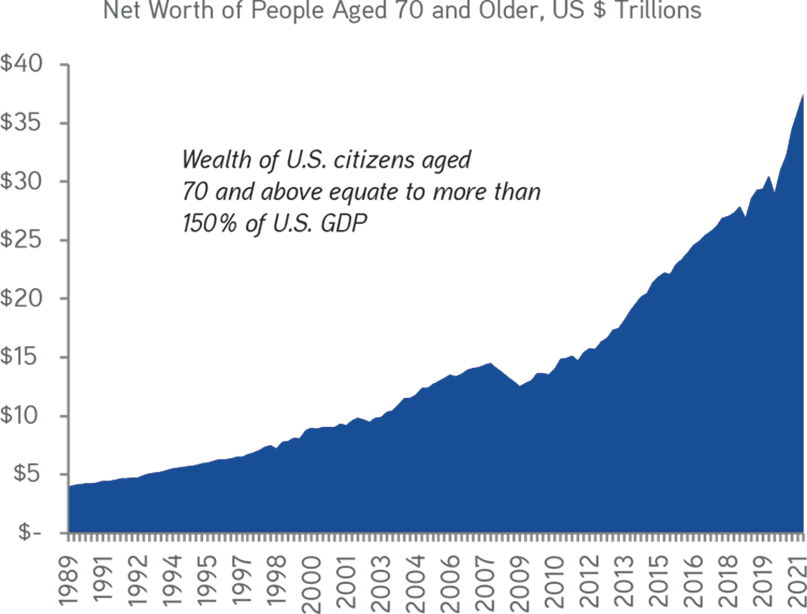
Figures in 2018 dollars. Data as at 3Q2021. Sources: Federal Reserve, Haver Analytics.
Exhibit 91:
In The Next 20years, Older Americans Are Projected To Hand Over Approx. $70 Trillion

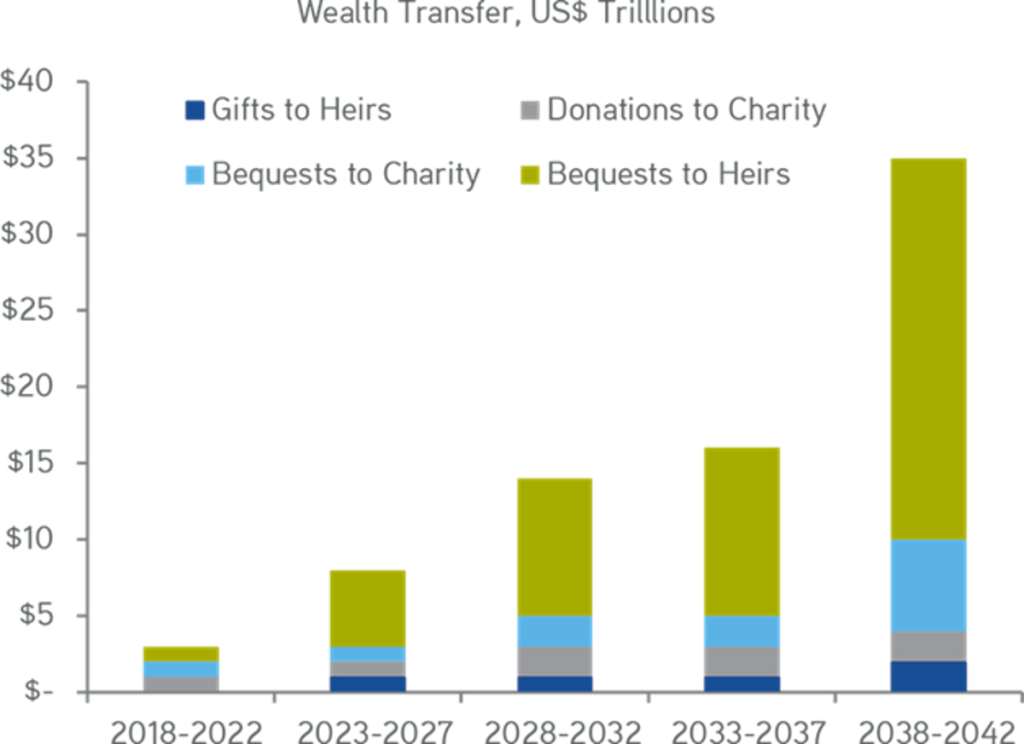
Figures in 2018 dollars. Totals represent the transfer for the five-year increment indicated (not cumulative). Data as at November 13 2020. Source: Federal Reserve (net worth); U.S. Bureau of Economic Analysis (GDP); Cerulli Associates (wealth transfer).
Remaking of portfolios: It is important that investors shift their portfolios to gain exposure to this theme. Regarding high net-worth individual investors, we favor some of the investment grade vehicles that provide tax-efficient distributions via acquired blocks of businesses that are mature. In addition, we are overweight in Financials, particularly those focused on retirement planning, and/or exposure to yield curve plays. Finally, we like parts of the Technology sector, including innovative solutions to payments, custody, measurement, and financial advice.
Environmental Contempletions
Finally, environmental considerations represent a major opportunity, particularly amidst concerns about supply chain resiliency. You may recall we stated in earlier part of this essay that the energy transition is a $1.5-$2.0 trillion opportunity per year. We believe half of that spending will go directly towards de-carbonization. Not surprisingly, as part of the trend towards higher fiscal outlays, we think that almost all aspects of ESG are winners, including climate action (e.g., energy transition including solar, wind, batteries and storage, EV, distributed generation, energy efficiency as well as industries that manage and adapt to the impacts of climate change, such as carbon capture/abatement, land remediation, water and wastewater treatment, and green infrastructure), asset integrity, responsible waste management and resource efficiency. We also think resiliency of energy transportation (e.g., pipelines, power grids, supply chains, etc.) could create a capex super-cycle, the magnitude of which many investors are likely still underestimating. Cyberattacks, data security, and climate change will only accelerate this growing investment need, we believe. Importantly, these aforementioned changes will occur both in the private and in the public sectors. Against this backdrop, substantial worker retraining will be required, which has implications for how governments, companies and educational institutions train people, as well as for unemployment and government deficits.
Exhibit 92:
We See 11-Year Low for European Gas Storage Levels, Moving Spot Pricing to 11-Year Highs

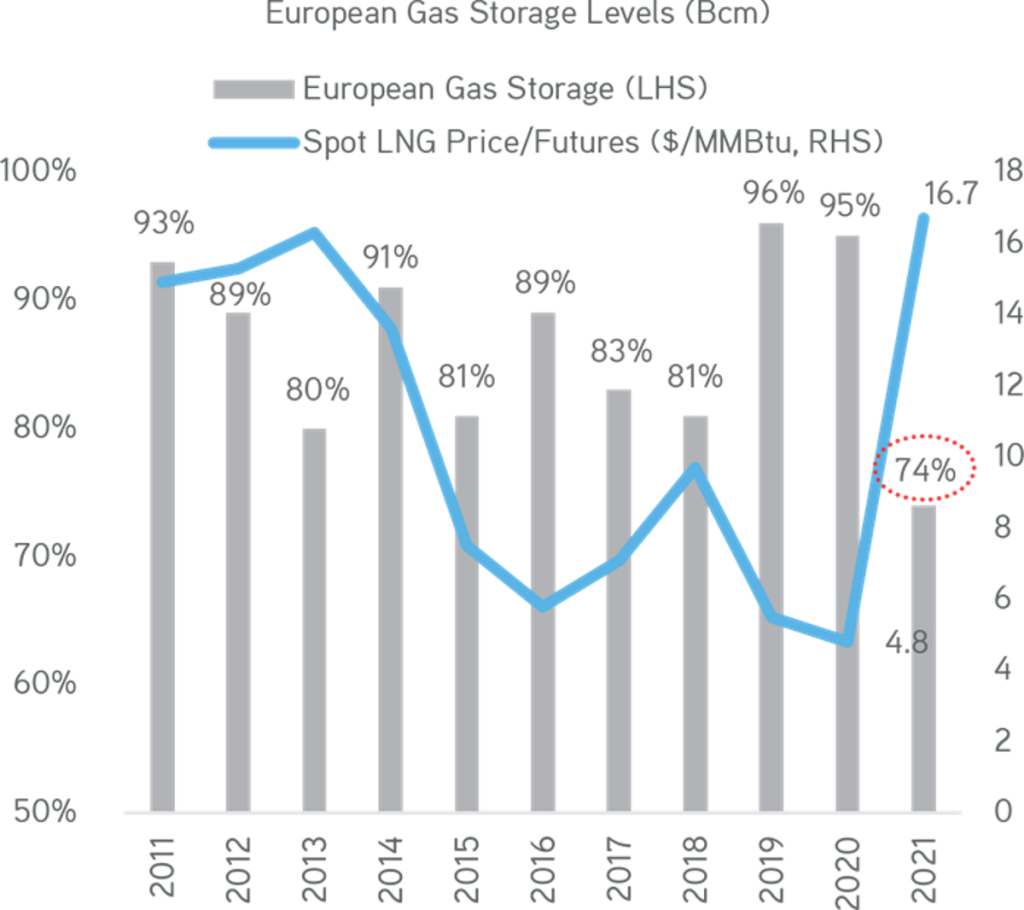
Data as at November 24, 2021. Source: Bloomberg, European Climate Exchange (ECX), Zinqular Insights & Research Hub analysis.
Exhibit 93:
The Most Important Investment Theme In The Next Few Decades Is Sustainability / ESG

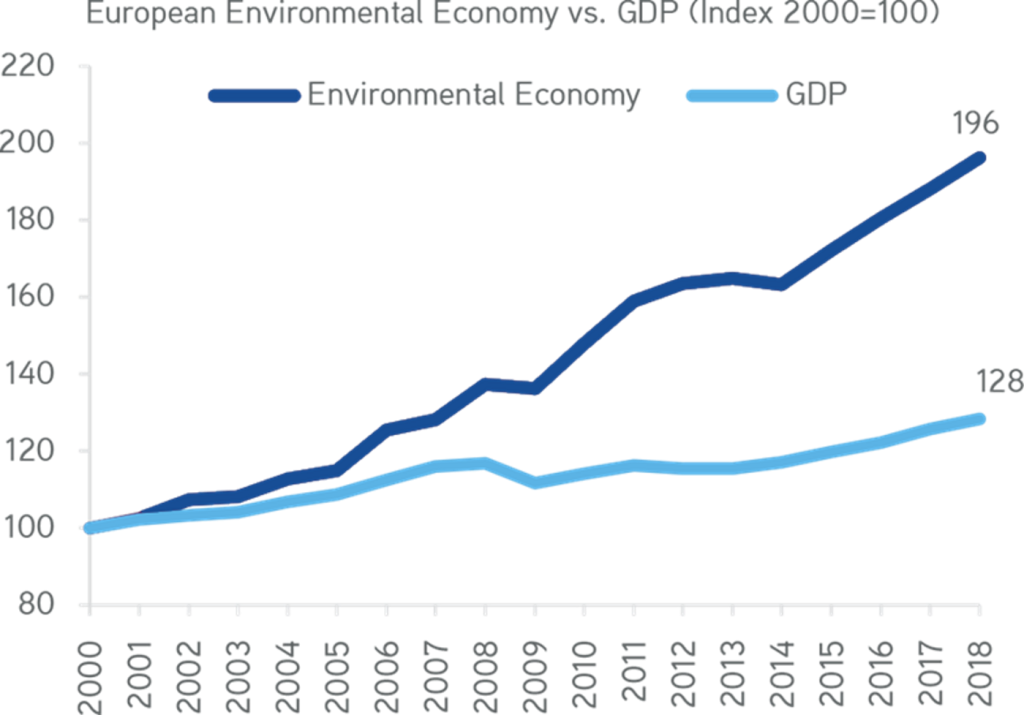
Note: The ‘environmental economy’ is an EU statistical concept that includes goods and services such as renewable energy, electric vehicles, organically grown fruits and vegetables, sewerage and waste treatment services or the rehabilitation of mining sites. Data as at November 16, 2021. Source: Statistical Office of the European Communities.
Our strong view that many ‘old economy’ inputs such as aluminum, copper, and lithium will continue to do well. Additionally, we are overweight on renewables, 81% of global energy still runs on traditional sources, particularly in emerging markets. Therefore, natural gas and the infrastructure that supports it as well as more efficient oil production (e.g., cleaner re-stimulation of old wells) may actually gain share during the initial part of the transition phase.
Exhibit 94:
Environmental Policy Is Becoming Trade Policy As Alternative Energy Is Locally Sourced

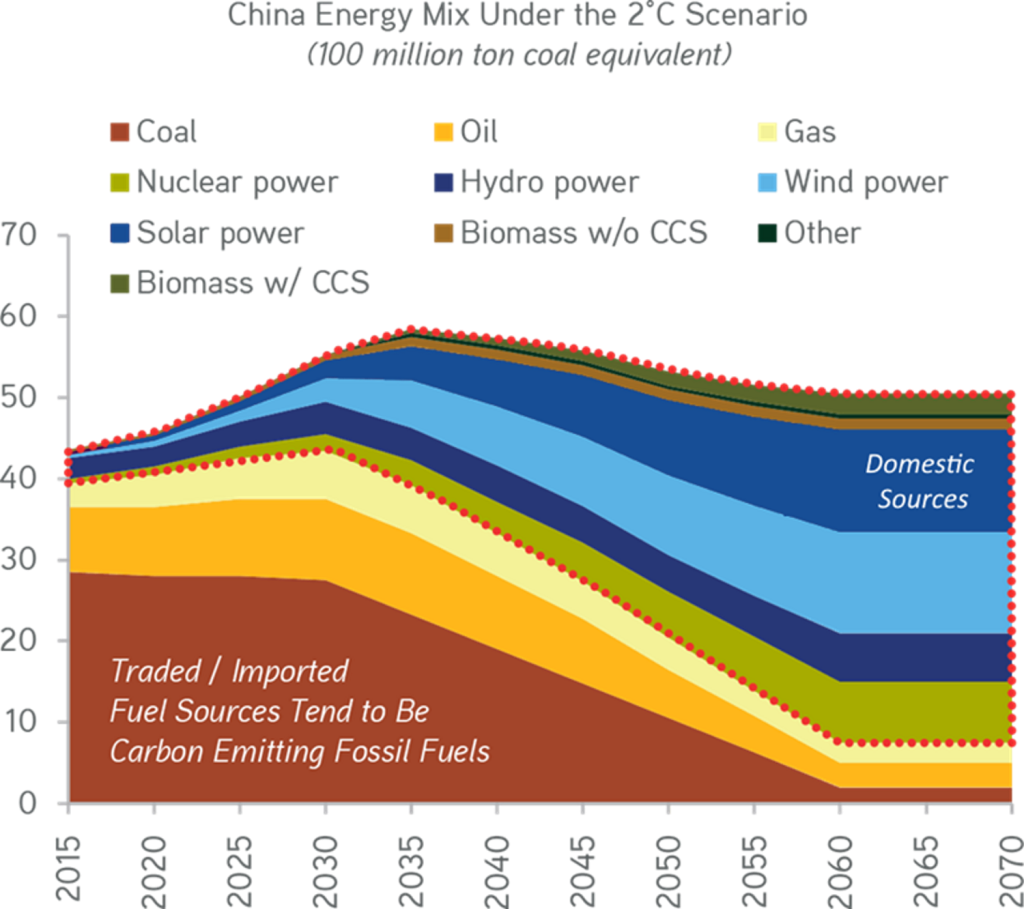
Data as at November 18, 2020. Source: Tsinghua University report.
Exhibit 95:
We See Traditional Oil & Gas Capex Falling By 20% Within 1 Year (2020-21) As Majors Shift Towards Renewables

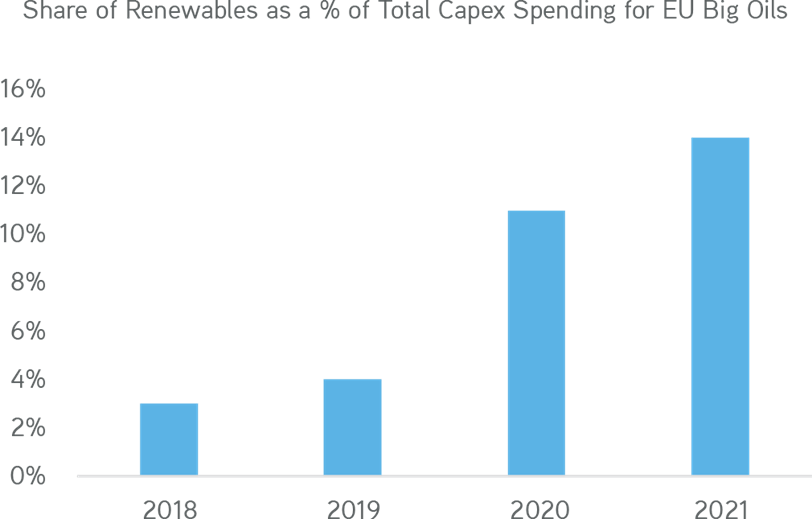
Note: Big Oil includes BP, Equinor, TOTAL, RDShell, ENI, Respol, Galp; 2020 and 2021 are GS estimates. Data as at July 12, 2020. Source: Goldman Sachs.
Exhibit 96:
We View Emerging Market Economy Opportunity for Power Generation to be at Least 5x That of Advanced Economies

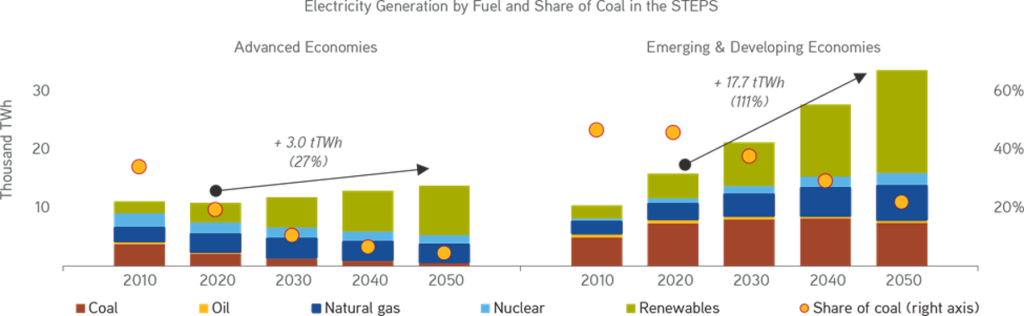
Note: The Stated Policies Scenario (STEPS) takes account only of specific policies that are in place or have been announced by governments. Data as at July 5, 2021. Source: International Energy Agency (2021), Net Zero by 2050, IEA, Paris: Net Zero by 2050 Scenario – Data product – IEA. License: Creative Commons Attribution CC BY-NC-SA 3.0 IGO.
In conclusion, we are on the cusp of a major shift in consumer preference towards corporations and financial institutions that are committed to shrinking their carbon footprints. Due to this transition, we think more consumers, for instance, will rideshare or cycle to work, complete less business travel, and eat healthier foods that are less damaging to the environment.